Background
Every year the Congressional Budget Office (CBO) issues a long-term budget outlook covering the next 30 years. The last such report was released on March 4, 2021 and covered the 30 years ending in 2051. These reports are not predictions of the future. Instead, they are described by CBO as “projections of what federal debt, deficits, spending, and revenues would be for the next 30 years if current laws governing taxes and spending generally did not change.” They include CBO’s projections of demographic and economic factors over the 30-year period.
The CBO’s long-term reports are designed to “give lawmakers a point of comparison from which to measure the effects of policy options or proposed legislation,” but they also serve as a warning signal of troubling trends and the potential consequences of inaction.
At first blush, projections that look so far into the future may appear meaningless. Decades ago, a budget window of one to five years might have been sufficient when most of federal spending was determined through annual appropriations. It is not sufficient now, however, when more than 60 percent of the budget consists of mandatory spending, such as Medicare, Medicaid, and Social Security. Spending on these programs is not determined on an annual basis. Rather, they operate unchanged, year after year, based on statutory eligibility criteria, demographics and health care costs — at least until lawmakers decide to make a change. A longer perspective is required for these programs to assess whether the budget is on a sustainable path.
Long-term projections are inherently uncertain, but it is nevertheless important for policymakers and the public to have a sense of where spending and revenues are headed based on current law. When looking a decade or more into the future, trends and key drivers are more important than predictive accuracy in levels for any given year.
Deficits and Debt
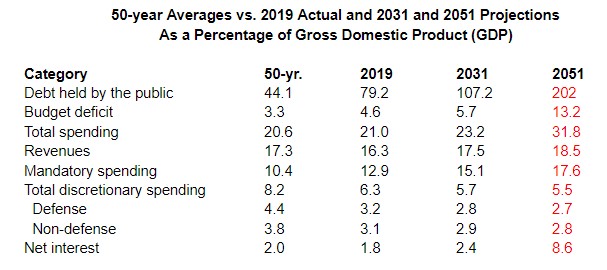
Fiscal year 2020 was highly unusual because of the large spike in spending caused by legislative actions to support individuals, families, businesses, and local governments during the COVID-19 pandemic. The deficit jumped from $984 billion (4.6 percent of GDP) in 2019 to $3.1 trillion (14.9 percent of GDP) in 2020. Debt held by the public jumped to 100 percent of GDP from 79 percent in 2019. Deficit and debt levels will be unusual this year as well due to the ongoing effect of COVID relief legislation. For that reason, a more accurate picture of long-term trends is shown by using 2019 (a more “normal” year) as the starting point.
In CBO’s projections, spending and revenues both grow as a share of GDP over the next 30 years, but spending is projected to grow faster. This structural gap is already apparent in the 10-year budget outlook.
The table below shows the projected trends of major budget categories for 2019, 2031 (the end of CBO’s current 10-year budget baseline), and 2051 (the end of CBO’s 30-year “baseline extended” projection). Deficits and debt spike over this period, driven by higher mandatory spending, relatively flat revenues, and accumulating interest costs.
It should be noted that these projections assume the scheduled 2025 expiration of tax cuts for individuals enacted in 2017 and the expiration of various short-term income support provisions in President Biden’s American Rescue Plan, enacted in March of 2021. Extending these tax cut and spending provisions without offsets would lower projected revenues, increase mandatory spending, and add considerably to the deficit and debt totals shown below.

CBO notes that the level of debt in 2051 “would be the highest by far in the nation’s history, and it would be on track to increase further.” In CBO’s assessment, “Debt that is high and rising as a percentage of GDP boosts federal and private borrowing costs, slows the growth of economic output, and increases interest payments abroad. A growing debt burden could increase the risk of a fiscal crisis and higher inflation as well as undermine confidence in the U.S. dollar, making it more costly to finance public and private activity in international markets.”
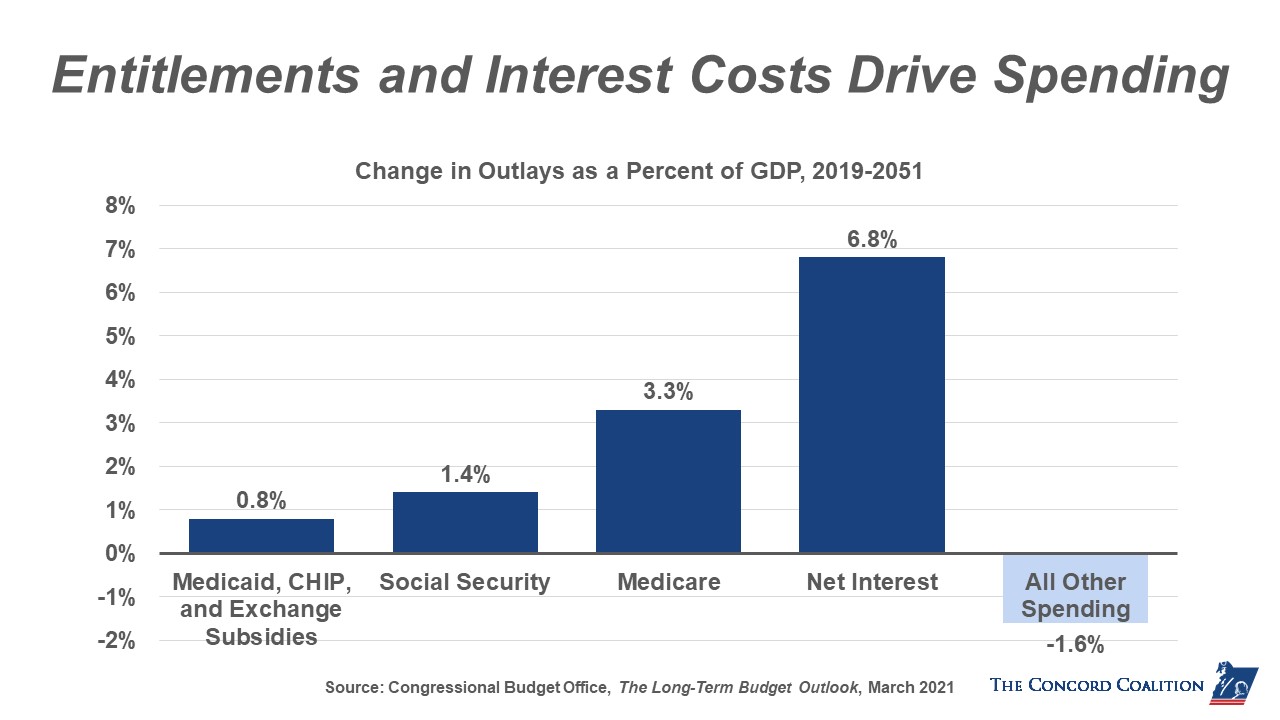
The main cost drivers of mandatory spending are Social Security and the major health care programs, which include Medicare, Medicaid, the Children’s Health Insurance Program, and premium subsidies under the Affordable Care Act. Spending on other programs, including national defense and domestic appropriations, is actually projected to decline slightly as a share of GDP. Net interest cost begins at a relatively low level but accelerates rapidly in the final two decades of the 30-year projection (2031-2051) due to rising debt and higher interest rates.
Root Causes
The root causes of the growing debt are easy to discern: population aging, rising health care costs, slowing workforce growth, and rising interest payments.
- Population aging. The share of the population aged 65 and older will grow from 17 percent this year to 22 percent in 2051. This translates into higher spending for Social Security and the major health care programs. According to CBO, “federal spending for Social Security, Medicare, and Medicaid for people age 65 or older would account for about half of all federal non-interest spending by 2051, rising from about one-third in 2021.” By 2051, CBO projects that under current law spending for these programs would grow to 15.7 percent of GDP from 10.2 percent of GDP in 2019. To put that in context, if those programs equaled 15,7 percent of GDP today they would add about $1 trillion more to the budget.

- Health care costs. Spending on the federal government’s major health care programs is projected to continue growing faster than the economy. This adds to the cost growth caused by the increase in beneficiaries. By 2051, CBO projects that spending on the major health care programs would grow to 9.4 percent of GDP from 5.3 percent of GDP in 2019. Only one-third of that growth comes from population aging, while the remaining two-thirds comes from rising costs per beneficiary. When looking at Medicare and Social Security combined, CBO notes that “if the population was not aging and health care costs per person (adjusted for demographic changes) grew with potential GDP per person—that is, more slowly than the agency currently projects—spending on Social Security and the major health care programs as a share of GDP would be slightly lower in 2051 than in 2019.”

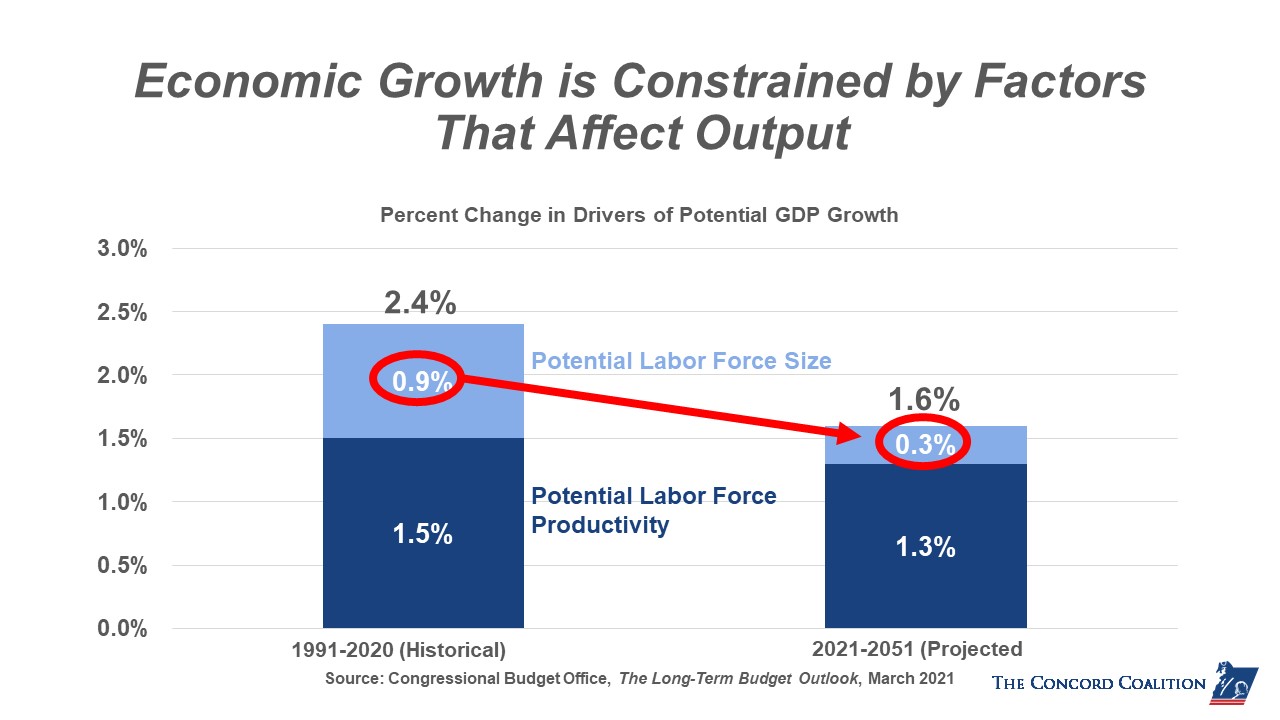
- Slower labor force growth. Budgetary pressure is not the only consequence of an aging population. It also has an effect on the economy. Our economy can only grow as fast as we can produce output which is constrained by two key variables – the size of our labor force and the productivity of those workers. In addition to population aging, demographers have observed for years that American women are marrying later and having fewer children. As a result, CBO projects that our future potential labor force growth will slow markedly, nearly two-thirds slower than the historical average. As a consequence, policymakers cannot count on economic growth alone to close the expanding budget gap.
The CBO projects that the economy will grow at an average annual rate of 1.8 percent over the next 30 years (adjusted for inflation). That would be a significant drop from the 2.3 percent average over the past 30 years. This means that achieving growth anywhere near past levels will require new policies that increase the size of the labor force and improve productivity.

- Interest costs on the debt. Low interest rates on government debt slow but do not halt the unsustainable path we’re on. The constant accumulation of massive new debt each year will eventually overwhelm the effect of low interest rates. In CBO’s projections, interest costs rise from a modest 1.8 percent of GDP in 2019 to a staggering 8.6 percent of GDP in 2051, equivalent to nearly half of all projected revenues in that year. CBO notes that net interest “accounts for most of the growth in total deficits in the last two decades of the projection” and would surpass spending for Social Security by 2045.

Social Security and Medicare cash flow deficits add to our fiscal imbalance
Social Security and Medicare have dedicated sources of revenue. For that reason, many people assume that these programs are self-sufficient. As CBO makes clear, however, the dedicated taxes that underpin these two programs (mostly from payroll taxes and Medicare premiums) do not cover the full amount of benefit payments. Moreover, the fact that Social Security and Medicare currently have positive trust fund balances tends to obscure the fact that the programs’ cash deficits are a major factor in current and projected general fund deficits. In the long-term update, CBO projects that Social Security’s cash deficit will grow from 0.6 percent of GDP in 2021 to an average of 1.9 percent in 2042-2051, and Medicare’s cash deficits will grow from 1.7 percent of GDP in 2021 to an average of 4.4 percent of GDP in 2042-2051.
Implications for policymakers
Policymakers must acknowledge that the nation’s current debt trajectory is unsustainable. Ignoring our long-term structural fiscal and economic problems will not make them go away. The longer we wait to act, the more difficult the solutions will be — and the greater the risks will be to the nation’s future. While low interest rates now make financing our current debt easier, they do not prevent an overwhelming accumulation of new debt and future spiraling interest costs. Stronger economic growth will help, but projected debt levels are so high that economic growth alone simply cannot put the budget on a sustainable path.
As the nation’s focus turns from the current crisis to the post-pandemic economy, policymakers should craft an agenda that is both pro-growth AND fiscally responsible. This will require policies that slow health care cost growth, make Social Security sustainably solvent, expand the workforce, invest more to enhance productivity, boost worker training, and bring in more revenue. An agenda premised on ever-low interest rates and ever-rising debt cannot, and will not, provide the solid foundation we need for a sustainable budget and a growing economy.


