Last week, the Congressional Budget Office (CBO) released its latest long-term projections for the Social Security program. Although these projections are roughly comparable to the Social Security and Medicare Trustees (Trustees) projections released earlier this year, there are important differences.
Both sets of projections assume Americans will live longer and have fewer children in the future, resulting in a declining ratio of workers-to-beneficiaries. As a result, Social Security will face substantial deficits throughout the projection period. But these deficits vary in size between the projections due to differences in economic and demographic assumptions. In several key respects, the Trustees’ projections tend to be more optimistic than CBO’s.
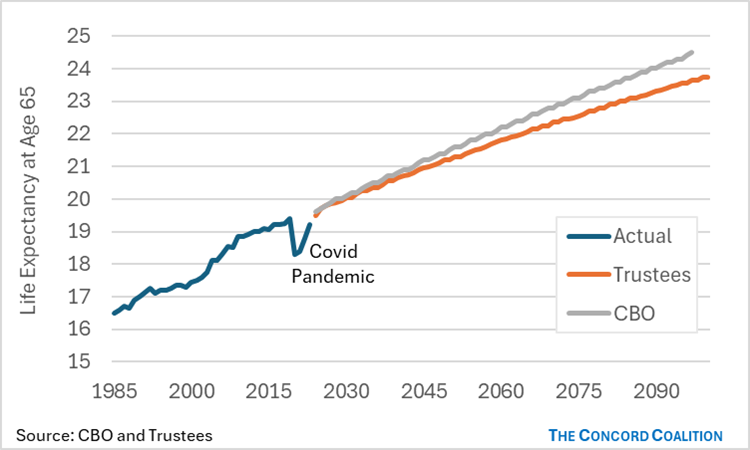
CBO projects average life expectancy at age 65 will increase faster than the Trustees. Living longer at older ages means seniors will collect benefits for more years, thereby increasing the cost of the program.
Figure 1: Average Life Expectancy at Age 65
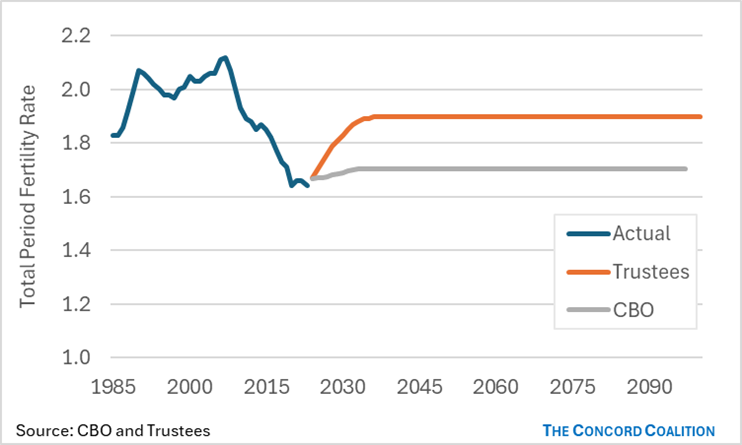
CBO projects the ultimate fertility rate will be 1.7 births per woman, whereas the Trustees project 1.9 births per woman. Lower birth rates mean fewer workers to support future beneficiaries.
Figure 2: Average Lifetime Births per Woman
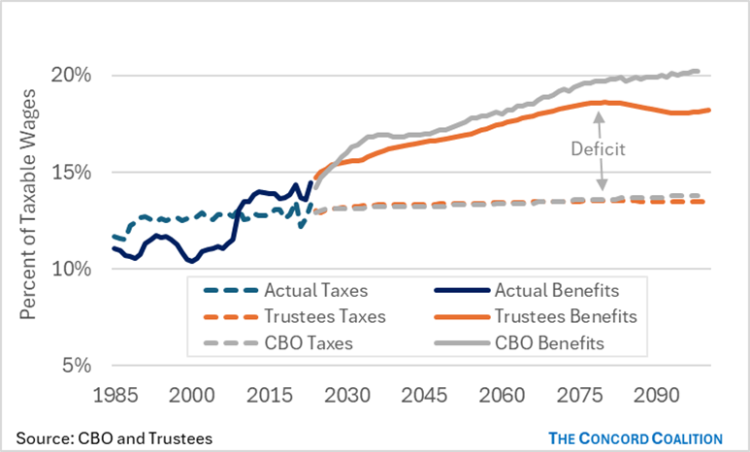
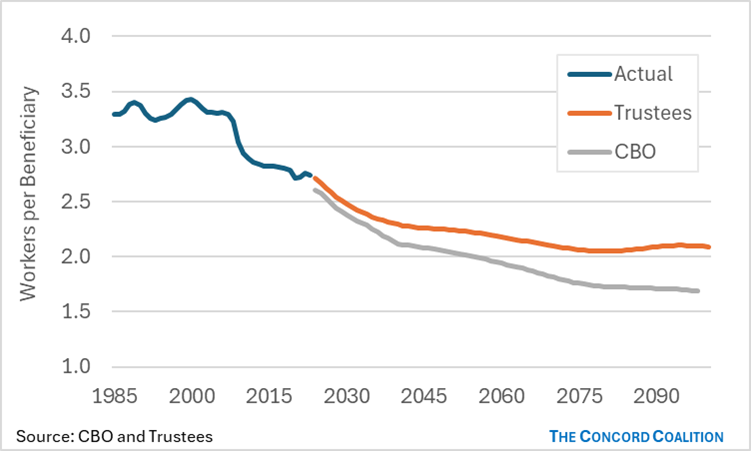
The combined effect of living longer and having fewer children will be a declining ratio of workers-to-beneficiaries. Fewer workers to support each beneficiary means the cost of annual benefits will rise relative to the amount of payroll taxes collected each year.
Figure 3: Ratio of Workers-to-Beneficiaries
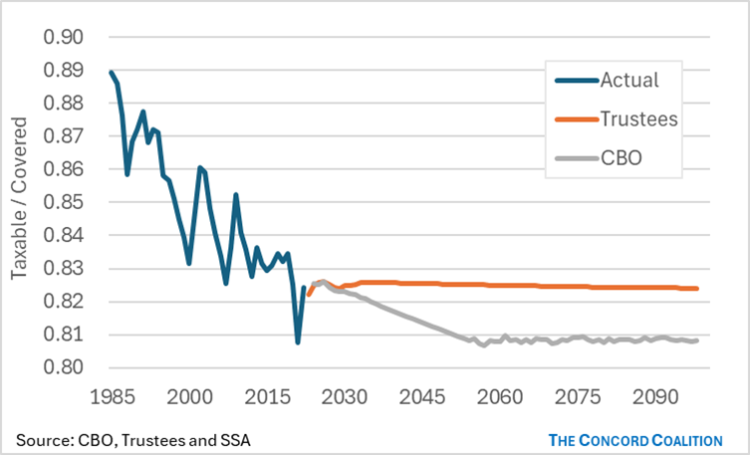
Another factor that contributes to the Social Security shortfall is the declining share of wages subject to the payroll tax. Wages (and self-employment income) below the maximum taxable amount determine the amount of payroll taxes collected each year, whereas wages above that amount contribute to the average wage index (AWI) used to calculate initial benefits for newly eligible beneficiaries. When wages above the taxable limit rise faster than wages below the limit, benefits can increase faster than revenue. The Trustees optimistically assume the taxable share remains constant, whereas CBO assumes the share continues to decline until the mid-2050s.
Figure 4: Share of Covered Earnings Below the Maximum Taxable Amount
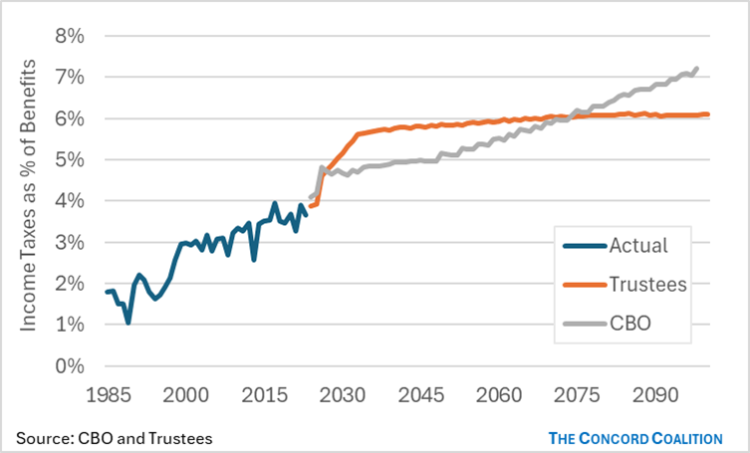
Another difference between CBO and the Trustees is the taxation of Social Security benefits. CBO assumes the income tax code is indexed to the rate of inflation as scheduled under current law, whereas the Trustees assume the tax code is indexed to average wage growth after the first ten years. Differences in other assumptions make the Trustees’ projections more optimistic in the short run, but these differences are offset by the indexing assumption, resulting in more pessimistic projections in the long run.
Figure 5: Income Taxes on Benefits as Percent of Social Security Benefits
Social Security projections rely on numerous economic and demographic assumptions. Given the different assumptions between CBO and the Trustees, it’s not surprising the size of future deficits vary between the projections. Although neither set of assumptions is likely to be entirely correct, the timely payment of scheduled benefits under either set of projections will remain in doubt until policymakers enact needed reforms.
Figure 6: Social Security Taxes and Benefits