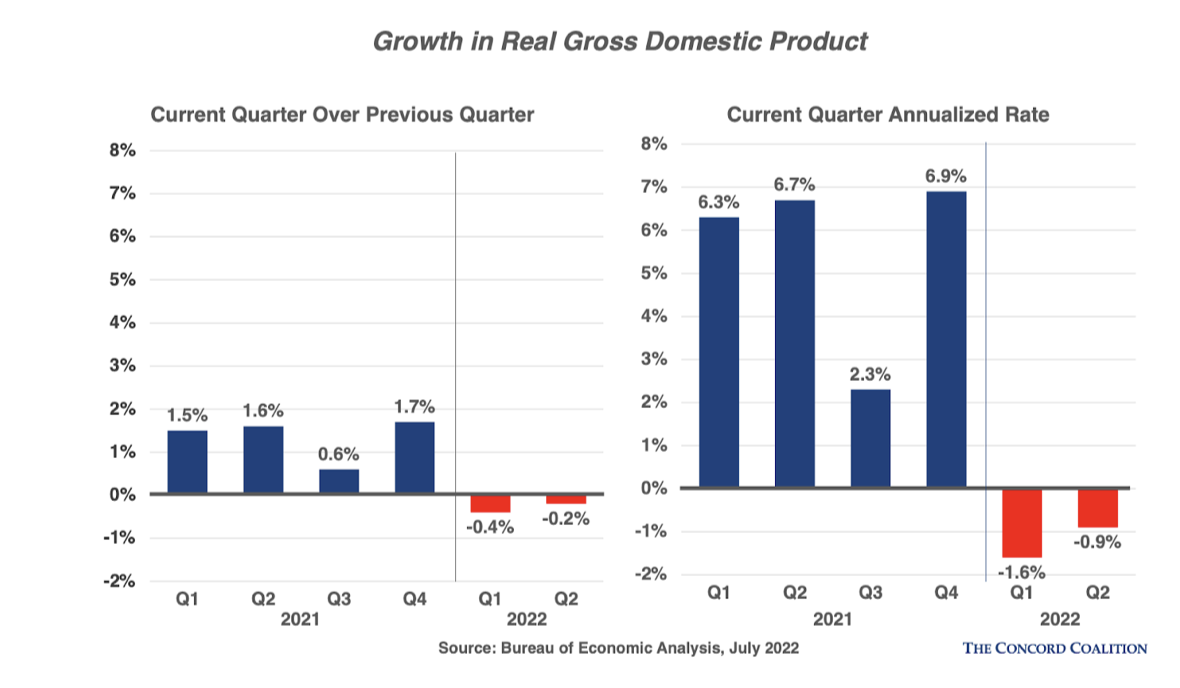
Recession chatter reached a fever pitch this week when, on July 28, the Bureau of Economic Analysis (BEA) released its preliminary (advance) estimate of real gross domestic product (GDP) for the second quarter of 2022. According to the BEA, the economy shrank 0.2% from the previous quarter (or -0.9% on an annualized basis), the second consecutive decline after the economy contracted at 0.4% in the first quarter (or -1.6% on an annualized basis). In economics, two consecutive quarters of negative real GDP typically signals a recession, but any economist will tell you this is a “rule of thumb,” not an empirical truth. And with the U.S. economy behaving in such a puzzling manner right now—low unemployment, high inflation, strong nominal wage growth and consumer spending, low productivity, and a Federal Reserve aggressively raising interest rates—it seems reasonable to ask, “Is the U.S. really in a recession?”
The non-profit, non-partisan National Bureau of Economic Research (NBER) Business Cycle Dating Committee is the official entity charged with identifying our economy’s peaks and troughs—and the periods of recession and recovery that follow. According to their own methodology, whether the U.S. is in a recession is based on a range of measures of real economic activity published by federal statistical agencies. These include measures of personal income, employment, consumer spending, wholesale and retail sales, and industrial production. Their website FAQ specifically states, “There is no fixed rule about what measures contribute information to the process or how they are weighted in our decisions.” In fact, after the second quarter data was released, NBER President and Chief Executive Officer James Poterba stated in an email to Bloomberg that the NBER doesn’t believe in the “two-quarter-declining GDP rule.” So, the question still lingers, is the U.S. in a recession?
Is Real Gross Domestic Income a Better Indicator than GDP?
In this somewhat bizarre post-COVID economy, several economists have instead looked to real gross domestic income (GDI) to answer this question. Whereas GDP sums up the final value of all goods and services produced in a given period, GDI sums up all the money earned from all of the goods and services produced in that same period. In theory, the two values should be identical and illustrate similar dynamics, but because they use different sources of data there is always some small discrepancy (typically less than 1%). In the post-COVID economy, however, an unprecedented gap has emerged between GDP and GDI. GDI has recovered significantly faster than GDP, suggesting a stronger underlying recovery in economic output than GDP. When GDI from the first quarter of 2022 was released on May 26, the gap between GDI and GDP had grown to 3.5 percent—the largest on record.
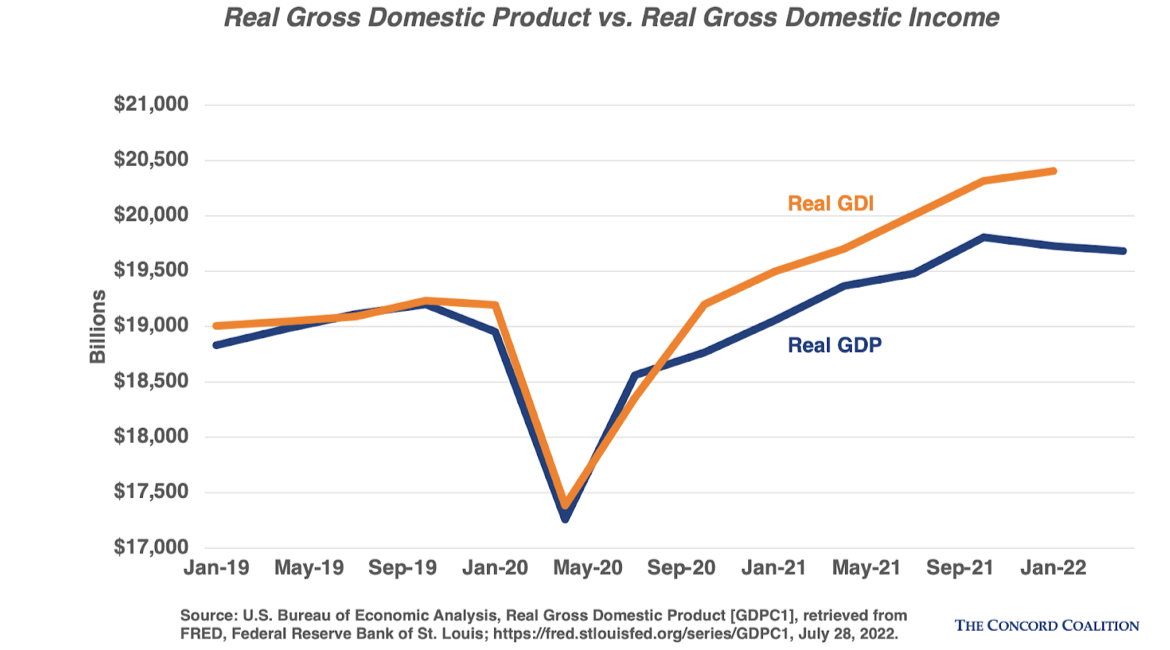
Given what Americans are experiencing now in real time (very low unemployment, very high inflation, strong consumer spending) plus the fact that individual income tax collections are posting double-digit growth, real GDI appears to “fit” the post-pandemic story better than real GDP. If GDP is the better reflection of reality, economic output is still below its pre-pandemic trend (and shrinking) but if GDI is accurate, the economy is 1.2% above trend, a far stronger recovery—and not in a recession. (Note: GDI for the second quarter will be released on August 25 along with the BEA’s second estimate of second quarter GDP).
Still, both GDI and GDP are backwards looking data and they’re published with significant time lags. They don’t tell us what’s happening now. Are there better indicators to answer the recession question?
The Inverted Yield Curve
Wall Street’s favorite recession indicator is the yield curve. A yield curve compares the interest rates on Treasury securities of various durations (e.g., 3 months, 2 years, 5 years, 10 years, 30 years). Because of the risk inherent in locking up money long-term, bond investors expect to be paid more to hold longer-maturity bonds, so interest rates on short-term Treasuries are usually lower than rates on longer-term maturities. Plotted out on a chart, the yields form an upward sloping line — the yield curve.
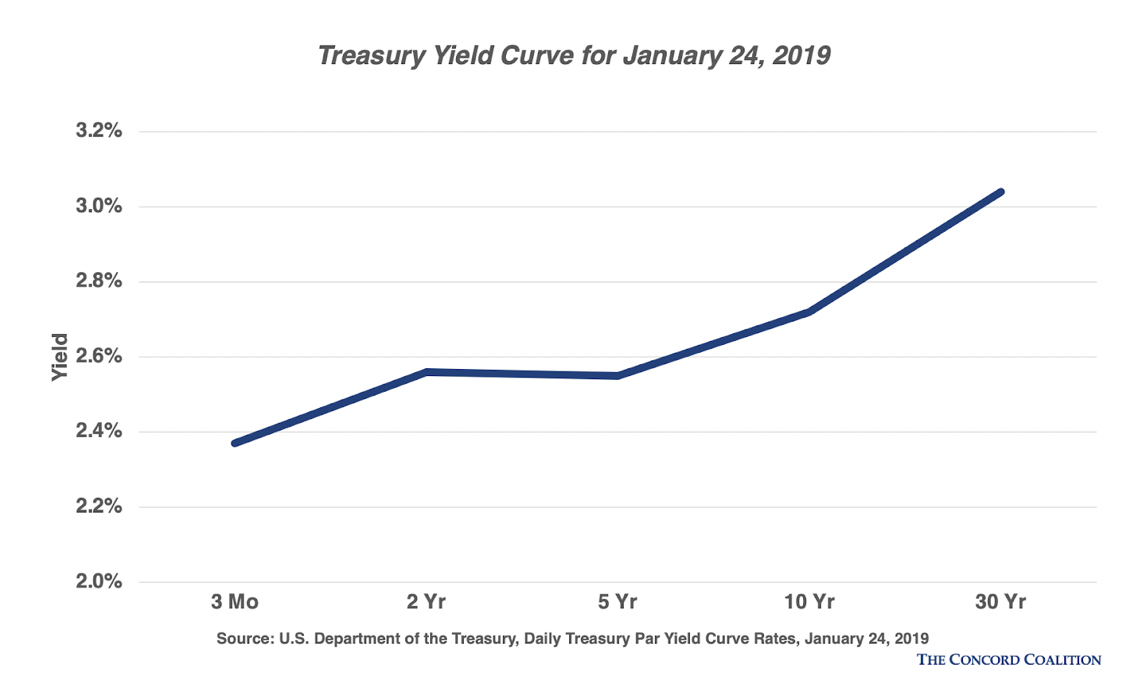
Sometimes, however, short-term rates rise above long-term ones, especially when investors fear an economic slowdown in the near term. This negative relationship causes the curve to invert (slope downward) at certain maturities. The signal carries some predictive weight, especially among 2-year and 10-year maturities, as an inversion has preceded every U.S. recession for the past half century and for most of July, the yield on 10-year Treasuries has been below the yields on 2-year Treasuries—an inversion.
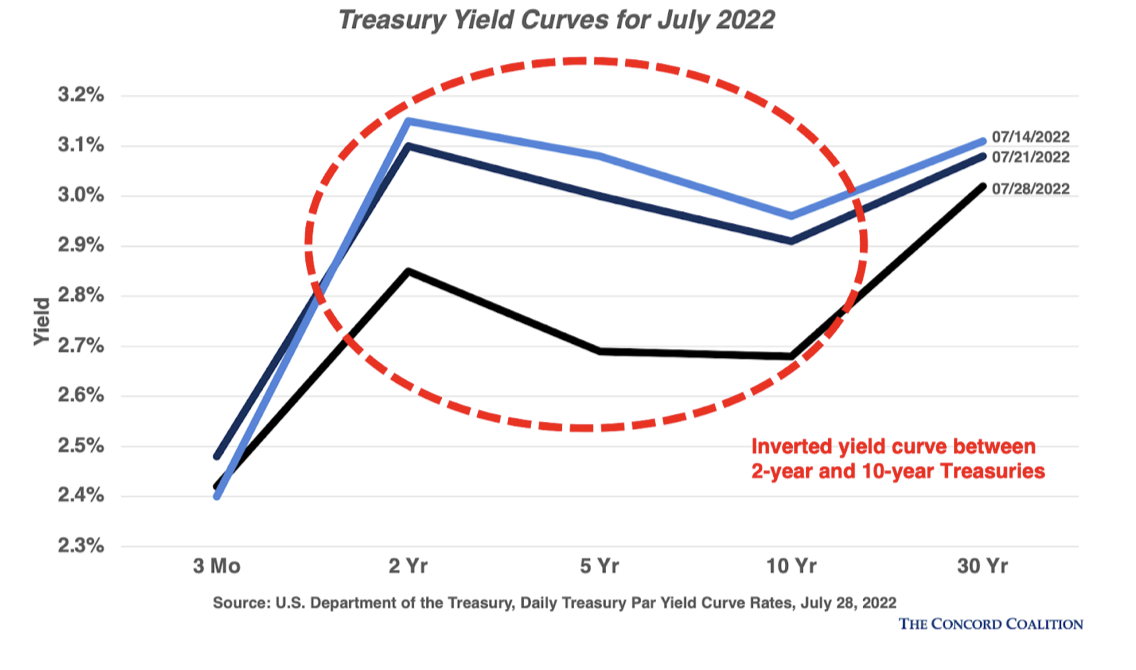
This recession signal is imprecise, however. While every recession has been preceded by an inverted yield curve, not every inverted yield curve has resulted in a recession. Plus, there is an important coda to the rule—an inversion provides no information on timing. The average time to a recession once yields on the 2-year rises above 10-year is 19 months, but the range runs from 6 months to 4 years (per the New York Times).
The Sahm Rule Recession Indicator
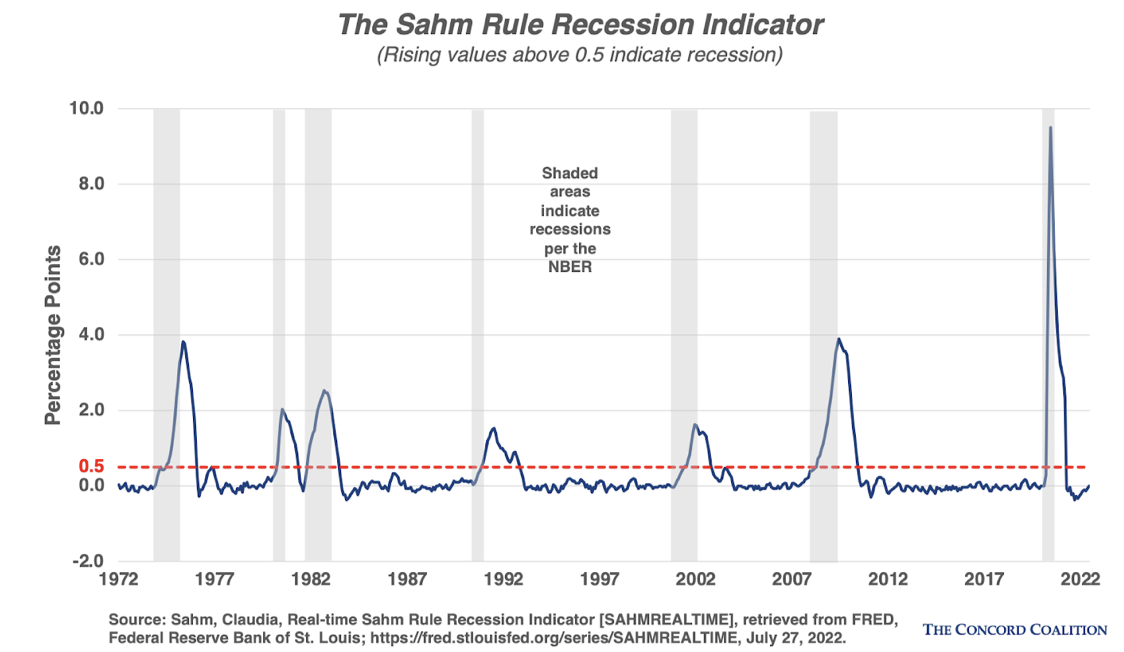
We can see that real GDP, real GDI, and the yield curve are imperfect signals of recession. GDP and GDI are backward looking data and released with significant time lags. The yield curve is temperamental and can throw off false signals. This is what makes the Sahm Rule Recession Indicator an interesting gauge. Eponymously named after former Federal Reserve and Council of Economic Advisors economist Claudia Sahm (sounds like “psalm”), the Sahm Rule is a “real time” method for determining when an economy has entered a recession. It relies on monthly unemployment data from the Bureau of Labor Statistics (BLS), a higher-frequency data set than quarterly real GDP. The rule signals the start of a recession when the three-month moving average of the national unemployment rate (U3) rises by 0.50 percentage points or more relative to its low during the previous 12 months.
According to the most recent entry of the Sahm Rule, the U.S. economy is not currently in a recession (the index has not crossed the threshold 0.5% line), but the risk of one is growing (the index is trending towards the threshold).


