Introduction
According to public opinion polls, most Americans believe the rich do not pay their fair share of taxes.[1] While these polls do not reveal what the public believes a fair share would be, many pundits and politicians suggest history should be our guide. Since enactment of the individual income tax in 1913, the top rate has ranged from a low of 7 percent to a high of 94 percent.[2] Given the top rate is now only 37 percent, there appears to be plenty of room to go higher. But appearances can be deceiving.
The top rate is only one feature of our tax system. By itself, the top rate tells us nothing about the amount of taxes paid by the rich. The high rates that existed in the past did not apply to every type of income, and they only applied to a fraction of total income, thereby providing opportunities for the rich to avoid paying such high rates and mitigating their negative economic impact. Thus, the belief that we “soaked the rich” before without any adverse effects, so we can do it again, is largely a myth. Ironically, this myth is at odds with another widely held belief that the rich currently pay little or no taxes, which is also largely untrue.
This issue brief will review the history of the top rate and examine four historical periods (1910-20s, 1930s, 1960-70s, and 1980s) in which the top rate changed significantly, either up or down. The evidence shows the rich responded to these changes by reporting more income when rates were lower and reporting less income when rates were higher. Aside from engaging in various tax evasion schemes (illegal), the rich also engage in tax avoidance schemes (legal) such as changing the amount of income they earn or shifting income between the individual and corporate tax systems. Each of these responses has important public policy implications for the debate over income inequality, tax revenue, deficit reduction, and economic growth.
Higher marginal tax rates cause the rich to report less income, thereby reducing the gap between rich and poor. But the reduction in income inequality is more apparent than real when income is shifted to the corporate business sector. This shift will determine whether higher rates increase or decrease the amount of revenue available to reduce the deficit. Higher rates also reduce the incentive to work, save, and invest which will reduce economic growth. As a result, the government will collect less revenue than might otherwise be expected. The magnitude of these effects is uncertain, thus the fiscal implications of taxing the rich are difficult to determine. Nevertheless, policymakers should not ignore these tradeoffs.
Addressing our nation’s long-term fiscal challenge will require additional revenue, including higher taxes on the rich. Both economic theory and empirical evidence suggest the best way to achieve that goal is to reduce credits, deductions, exemptions, and exclusions, rather than increase marginal tax rates – i.e., policymakers should look to broaden the base and lower the rates.
A Brief History of the Top Tax Rate
The individual income tax was enacted in 1913, following the ratification of the 16th Amendment which overturned an earlier Supreme Court decision that held the individual income tax was unconstitutional.[3] The corporate income tax, which was enacted in 1909, was considered an “indirect tax,” and thus not subject to the same constitutional challenge.
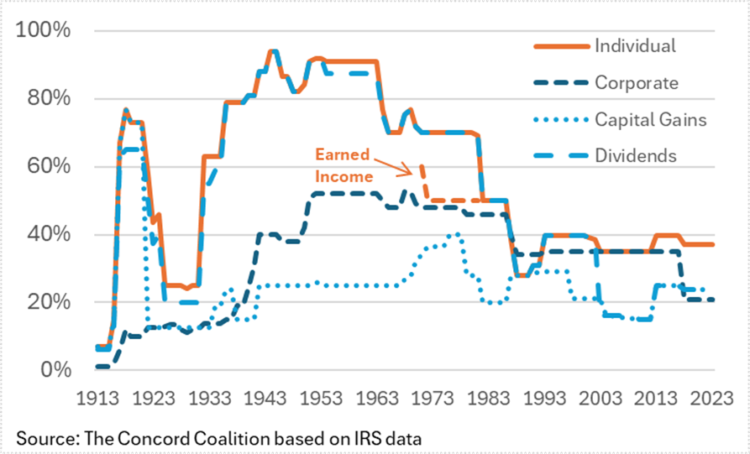
Both the individual and corporate income tax began with modest top rates of 7 percent and 1 percent, respectively. The top individual rate reached a high of 94 percent in 1944-45, and the top corporate rate reached a high of 53 percent in 1968-69.[4] However, the top rate has not always applied to every type of income. For example, capital gains, dividends, and earned income such as wages and commissions have often been taxed at a lower rate, and the interest earned on municipal bonds has generally been tax-exempt.
Figure 1 shows how the top income tax rates have varied throughout history. The individual income tax rate (orange solid line) and the corporate income tax rate (dark blue dashed line) have generally exceeded the rate on capital gains (light blue dotted line), while the rate on earned income such as wages and commissions (orange dashed line), and the rate on dividends (light blue dashed line) have occasionally fallen somewhere in between the other rates.[5]
Figure 1: Top Income Tax Rates by Type of Income (1913-2023)
Top tax rates are marginal tax rates (MTR). That means they only apply to the additional income earned above the specified threshold (or tax bracket). Income that falls below the top bracket is taxed at lower rates. The number of tax brackets has also varied over time. The combined total amount of taxes paid at each rate within each bracket, divided by total income, is the effective tax rate (ETR), which will be discussed later.
Pass-through businesses (partnerships, sole-proprietors, and S Corps) are subject to the individual tax rate, whereas C Corps are subject to the corporate tax rate. Thus, when these rates are different, some taxpayers can choose to report their business income in the category with the lower rate.
To evaluate the effects of the top tax rate on the amount of income reported by the rich, it’s necessary to consider the interaction between rates, brackets, credits, deductions, exemptions, and exclusions, as well as the distribution of income, and the ability to convert one type of income into another or categorize one type of business as another. Each of these factors affect the amount of taxes paid by the rich, not just the top rate.
A detailed assessment of each factor is beyond the scope of this issue brief. Nevertheless, the historical evidence indicates the rich respond to lower tax rates by reporting more income, and they respond to higher tax rates by reporting less income. The change in reported income likely reflects some combination of tax evasion (illegal behavior) and tax avoidance (legal behavior), depending on the circumstances. These results and their implications will be examined in more detail below.
1910s-1920s
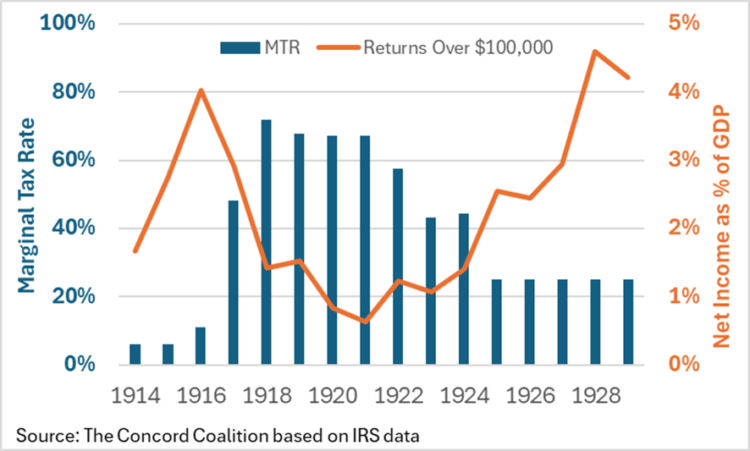
When the individual income tax was enacted in 1913, the top rate was 7 percent on income above $500,000. As the United States prepared to enter World War I, Congress increased the top rate to 15 percent on income above $2 million. In 1917, the top rate was increased to 67 percent, and in 1918 the top rate was increased to 77 percent and the threshold was lowered to $1 million. After the war, the top rate was gradually reduced along with the income threshold. From 1925 through 1929, the top rate was 25 percent on income above $100,000.
Figure 2 shows the relationship between marginal tax rates (MTR) and net income as a percentage of Gross Domestic Product (GDP).[6] Net income is the amount reported by individuals earning more than $100,000. Marginal rates reflect the weighted average for these same individuals.[7] The amount of income decreased in response to higher marginal rates, and then increased in response to lower marginal rates.
Figure 2: Relationship Between Marginal Tax Rates and Net Income (1914-1929)
1930s
Tax policy during the 1930s marked a complete reversal of the policy enacted in late-1920s. In 1932, the top rate was increased to 63 percent on income above $1 million. In 1936, the top rate was increased to 79 percent on income above $5 million. This reversal of policy did not change the direction of the results. Higher marginal tax rates resulted in less reported income.
Figure 3 shows the relationship between marginal tax rates (MTR) and net income as a percentage of Gross Domestic Product (GDP) using the same methodology as Figure 2. Once again, the amount of income reported by the rich decreased in response to higher marginal rates.
Figure 3: Relationship Between Marginal Tax Rates and Net Income (1929-1939)
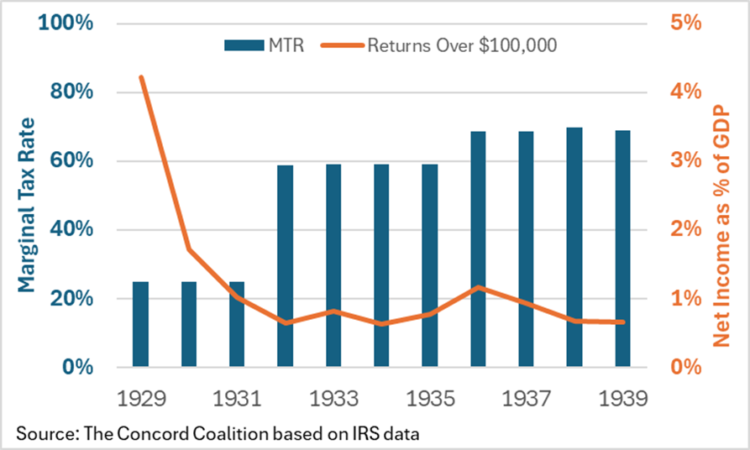
The precipitous decline in income, as well as the corresponding lack of additional revenue, drew the attention of policymakers. In 1937, Congress established the Joint Committee on Tax Evasion and Avoidance in response to a letter from President Franklin Roosevelt that stated in part, “The Secretary of the Treasury has given me a report… [that]… reveals efforts at avoidance and evasion of tax liability so widespread and so amazing in their boldness and their ingenuity that further action without delay seems imperative…. I am confident that the Congress will wish to enact legislation at this session specifically and exclusively aimed at making the present tax structure evasion proof.”[8]
The Joint Committee held a series of hearings focused on numerous schemes used by the rich to avoid paying higher taxes, including the individual use of the corporate business structure.[9] Despite congressional efforts to eliminate these schemes, they continued to proliferate. A more recent article in the LA Times explained how celebrities in the 1940s and 1950s converted their salaries into capital gains using a “collapsible” corporation.[10] Such schemes persisted into the 1980s.[11]
The inclination of pundits and politicians to describe these schemes as tax evasion and avoidance is understandable. However, the evidence suggests the rich were more likely to be shifting taxes rather than avoiding them entirely. As shown in Figure 1 above, there has typically been a significant difference between the top individual rate and the top corporate rate. The greater the difference between these two rates, the greater the incentive to report more income at the lower rate and less income at the higher tax rate. (Appendix: Elasticity of Taxable Income.)
1960s-1970s
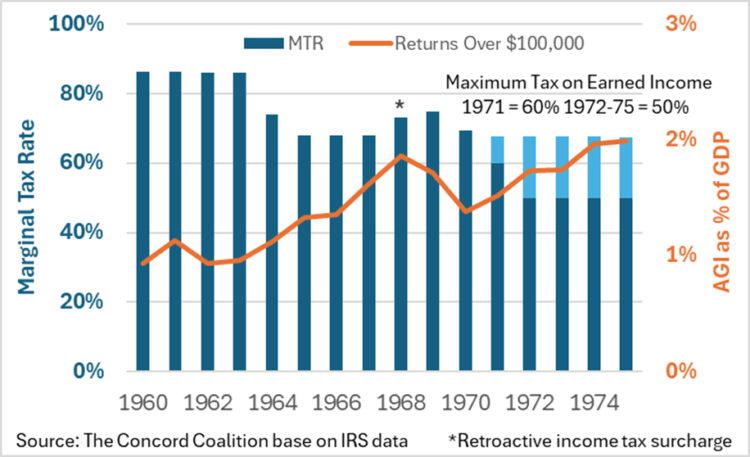
Between 1936 and 1963, the top individual income tax rate generally ranged between 80 and 90 percent.[12] In 1964, the top rate was reduced to 77 percent, and it was reduced to 70 percent in 1965. These rate reductions were partially offset by a temporary tax increase from1968 to 1970, which was followed by an effort to limit the top rate on earned income such as wages and commissions to 60 percent in 1971, and 50 percent thereafter. Although the limit was largely ineffective, it did reduce the top marginal tax rate for about one-third of the taxpayers who would have otherwise paid more than 50 percent.[13]
Figure 4 shows the relationship between marginal tax rates (MTR) and adjusted gross income as a percentage of Gross Domestic Product (GDP) using the same methodology as the previous figures.[14] Although the tax changes during this period were more complex, including the retroactive surcharge in 1968, the decline in marginal tax rates contributed to the rise in income reported by the rich.[15]
Figure 4: Relationship Between Marginal Tax Rates and Adjusted Gross Income (1960-1975)
1980s
In the 1980s, the top tax rate was reduced from 70 percent to 50 percent, and then to 28 percent. These reductions were partially offset by an increase in the top rate on capital gains from 20 percent to 28 percent. Because capital gains are only taxed when assets are sold, taxpayers can choose when to sell their assets to take advantage of lower rates or avoid higher rates.
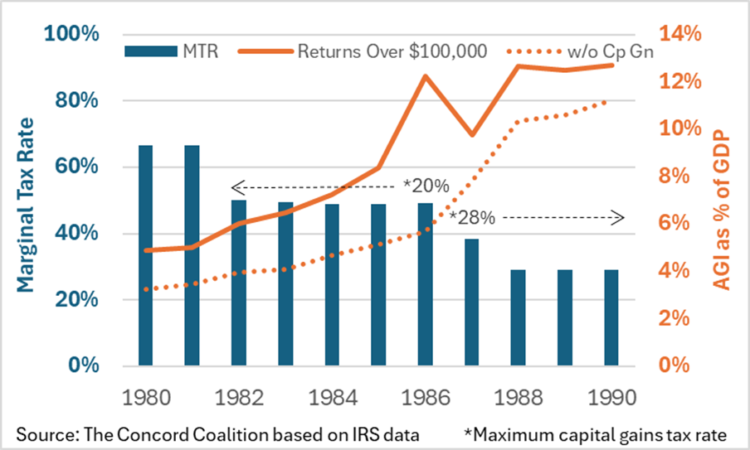
Because capital gains were such a large component of income during this period, Figure 5 shows the relationship between marginal tax rates (MTR) and adjusted gross income, both with and without capital gains, as a percentage of Gross Domestic Product (GDP) using the same methodology as the previous figures.[16]
Taxpayers increased capital gains realizations in 1986 to avoid paying the higher rate that took effect in 1987. Excluding capital gains, the same pattern emerges as before. The amount of other income reported by the rich increased in response to the lower marginal tax rates.
Figure 5: Relationship Between Marginal Tax Rates and Adjusted Gross Income (1980-1990)
The Rich Pay More Than Little or Nothing
Public support for higher taxes on the rich is primarily motivated by the belief that the rich do not pay their fair share.[17] It’s not clear what the public believes a fair share would be because the polls either don’t ask that question, or else they fail to distinguish between marginal tax rates (MTR) and effective tax rates (ETR). That’s a critical oversight. Even if the public believes millionaires should pay a 70 percent tax on each additional dollar they earn above $1 million (MTR), that reveals nothing about how much the public believes millionaires should pay on their total income (ETR).
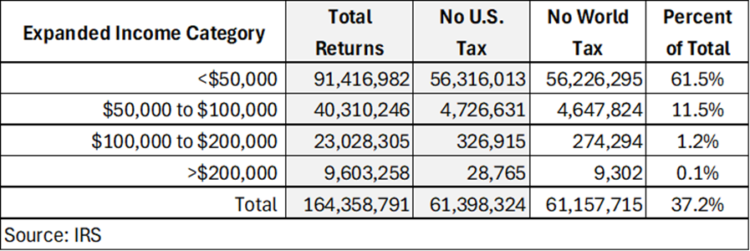
Many people believe the rich don’t pay any taxes. This belief is not entirely without some justification. According to the IRS, there were nearly 29,000 taxpayers with income over $200,000 in 2020 who paid an effective tax rate of zero or less.[18] Because the United States taxes the worldwide income of U.S. citizens, with some exceptions, but allows a credit or deduction for taxes paid to other countries, the number of taxpayers with income over $200,000 who paid zero or less on a worldwide basis was roughly 9,000. Overall, 37 percent of all taxpayers paid no income taxes, including 62 percent of taxpayers who earned less than $50,000. (See Figure 6)
Figure 6: Individual Tax Returns with and without U.S. or Worldwide Tax Liability (2020)
The single biggest reason some higher income individuals pay no taxes is due to the interest they receive on tax-exempt municipal bonds, which increases their income, but not their taxes.[19] These bonds are typically issued by state and local governments to finance construction projects like roads and schools.[20] The federal tax-exemption allows states and localities to pay a lower interest rate, thereby subsidizing the cost of these projects.[21] According to the U.S. Treasury Department, this exemption reduces federal revenue by roughly $50 billion a year.[22]
Even among the rich who pay taxes, there is a widely held belief they pay less than the middle-class. Again, there is some justification for this belief. According to the IRS, the median taxpayer paid an effective income tax rate between 0 and 5 percent in 2020. The median is the point at which half paid more, and half paid less. Among the 9.6 million taxpayers with income above $200,000, roughly 70,000 paid less than 5 percent.[23] (See Figure 7)
Figure 7: Distribution of Tax Returns by Effective Tax Rate (2020)
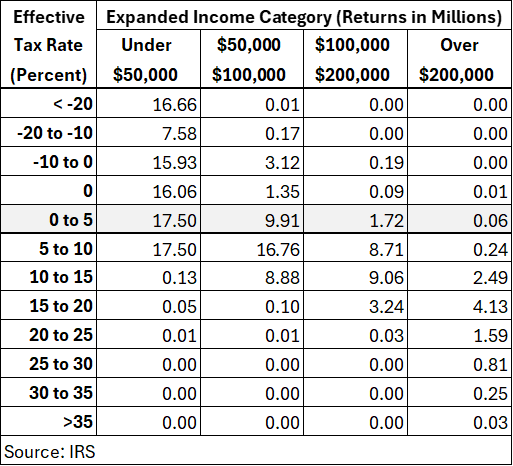
Although the top marginal tax rate is currently 37 percent, the effective tax rate is almost always less, in part because lower rates apply to income that falls within the lower tax brackets, but also because the tax rate on capital gains and dividends is less than the top rate on other income. The rationale for these lower rates is discussed below. (Double Taxation and the Economy)
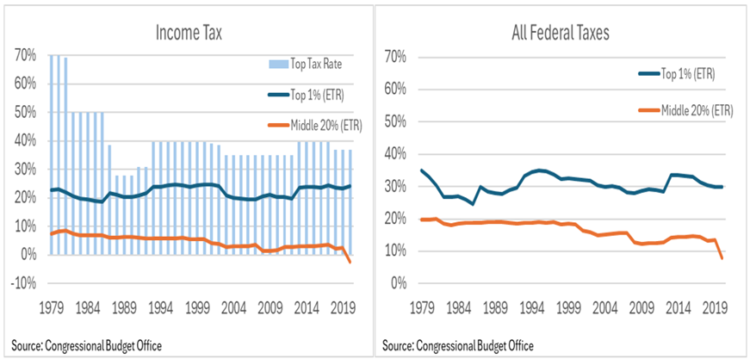
Although some higher income taxpayers pay little or no taxes, the richest taxpayers typically pay considerably more. According to the Congressional Budget Office (CBO), the top 1 percent of households paid an average ETR of 22 percent between 1979 and 2020.[24] That compares to an average ETR of 5 percent paid by households in the middle 20 percent of the income distribution.[25]
Figure 8 compares the ETR for the income tax only (left side), and the ETR for all federal taxes (right side). The left side shows the top 1 percent paid roughly the same ETR regardless of whether the top rate was 70 percent or 28 percent. This result was due in part to the lower rates that applied to capital gains, dividends, and earned income. The right side shows the top 1 percent paid an average ETR of 31 percent, whereas the middle 20 percent paid an average ETR of 17 percent.[26] Assuming these numbers were more widely known, it’s unclear whether the public would agree that’s a fair share or not.
Figure 8: Effective Tax Rates for Top 1% and Middle 20% of Households (1979-2020)
Assuming public support for higher taxes on the rich is based on the mistaken belief that they pay little or no taxes, then the proper course of action is to educate the public, seek consensus on what constitutes a fair share, and propose options to achieve that goal. These options would presumably focus on those who pay little or no taxes and the reasons for this, rather than those who already pay considerably more.
Double Taxation and the Economy
As noted above, some types of income are subject to a lower tax rate than others. The justification for a lower rate is based on the desire to reduce or eliminate the double taxation of savings. This double taxation occurs when income is taxed and any after-tax income that is saved is taxed again. The additional tax on savings reduces savings and investment, ultimately resulting in a less productive economy.[27]
The case against the double taxation of savings can be explained in terms of the time value of money, which is the rate at which people are willing to forgo current consumption in exchange for future consumption. This rate can be viewed as the discount rate in a present value calculation, or the expected rate of return on investment.[28] Assuming these rates are the same, whenever a tax is imposed on the income derived from savings (interest, dividends, or capital gains) people will not receive the present value of the original amount they initially invested.
For example, if people exchange current for future consumption at a rate of 10 percent, then $1 invested today will equal $1.10 one year later; or in present value terms $1.10 received in one year is equal to $1 today. Assuming a marginal tax rate of 25 percent, $1 invested today will have a present value of $0.977 one year later [$1.00+$0.10*(1-25%)] / (1+10%). Thus, a tax on the income derived from savings can be viewed as a double tax on savings because investors do not receive the present value of their initial investment.
The double taxation of savings affects the economy by increasing the cost of investing in capital assets, such as factories and machines or intellectual property. The cost of capital (or service price) is the gross return that an additional unit of capital must earn to cover the costs associated with its use. These costs include economic depreciation, due to wear and tear or technological obsolescence; taxes on businesses and investors; and a “normal” rate of return, which reflects the time value of money.
In the short run, taxes increase the cost of capital and decrease the after-tax rate of return, resulting in less investment. The historical evidence suggests businesses and investors forgo the least profitable investments until the amount of capital shrinks enough to restore a normal after-tax rate of return. Thus, in the long run, taxes on capital do not reduce the after-tax rate of return; instead, they reduce the amount of capital relative to the size of the economy.[29]
Figure 9 shows the correlation between the cost of capital (X axis) and the capital/output ratio (Y axis) for the corporate business sector.[30] The cost of capital is the value of business output (minus labor compensation) divided by the value of the capital stock; and the capital/output ratio is the value of the capital stock divided by value of business output.[31] The regression results indicate a 1.0 percent change in the cost of capital corresponds to a roughly equal but opposite change in the capital/output ratio of -0.8 percent (1950-2004). The correlation has been lower in recent years, perhaps due to the economic disruptions caused by the global financial crisis (2008-2009) and the Covid-19 pandemic (2020-2021).
Figure 9: Correlation between Cost of Capital and Capital/Output Ratio (1950-2022)
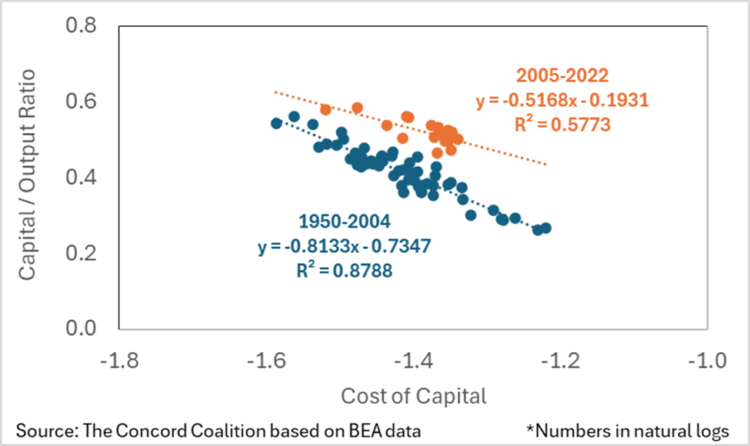
Despite the uncertainty surrounding the magnitude of the response, the regression results highlight the potential trade-off between taxing the rich and growing the economy. Decreases in marginal tax rates will expand the economy by increasing the supply of labor and capital, whereas increases in marginal tax rates will have the opposite effect.[32]
Conclusion
There are several reasons the American public supports higher taxes on the rich. Many believe the rich don’t pay any taxes, or they pay less than the middle-class. There is also a desire to raise revenue to reduce the deficit or pay for other priorities; reduce income inequality through higher taxes on the rich and larger transfers to the poor; as well as a lack of concern about the potential economic impact of higher taxes on the rich.
Addressing our nation’s long-term fiscal challenge will require additional revenue, including higher taxes on the rich. However, before policymakers succumb to the popular desire to impose higher marginal tax rates on the rich, they should consider whether taxes are as unfair as many people believe. They should also consider the potential unintended consequences of higher marginal tax rates. When rates are higher, the rich report less income and shift more income into the corporate sector – assuming the corporate rate is lower. This shift simply makes the income distribution more opaque, rather than more fair.
Higher marginal tax rates also reduce the incentive to work, save, and invest which will reduce economic growth. As a result, the government will collect less revenue than might otherwise be expected, potentially reducing the size of the economy by more than a dollar for each additional dollar of revenue collected.[33] In that case, everyone loses, not just the rich.
There are many ways to raise additional revenue from the rich, other than increasing marginal tax rates. The tax code is replete with tax expenditures (“loopholes”) that tend to confer higher benefits on those with higher incomes. In 2024, CBO projects that tax expenditures will total $2.1 trillion, roughly equal to 43 percent of all revenues.[34] Policymakers would do well to consider limiting tax expenditures as an alternative to simply raising rates as a way of seeing that the rich pay their “fair share.”
_____________________________________________________________________________________________________
Appendix: Elasticity of Taxable Income
Each of the historical periods examined above shows there is an inverse relationship between marginal tax rates and the amount of income reported by the rich. Higher tax rates correspond to lower income, and lower tax rates correspond to higher income. Economists have tried to quantify this relationship using a metric known as the elasticity of taxable income (ETI). This relationship is important because it affects the amount of revenue collected by the government.
Some economists have suggested the ETI can be used to determine the revenue maximizing rate, which is the tax rate that generates the greatest amount of revenue. But there is no consensus on the value of the ETI, which undoubtedly changes over time due to the evolving nature of our tax system. Moreover, the value of the ETI cannot be determined without including the corporate tax.[35]
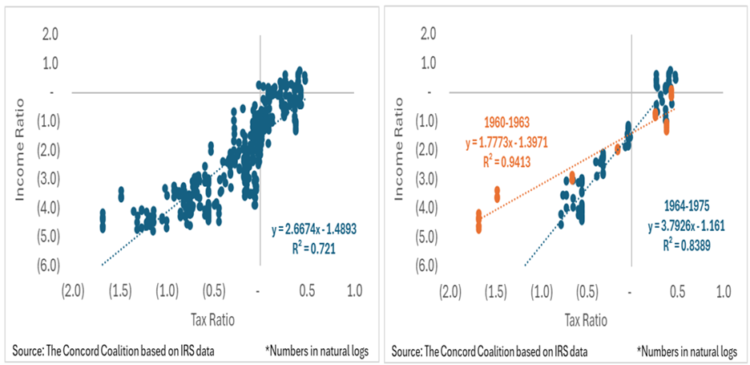
The importance of including the corporate tax can be illustrated by comparing the relationship between the individual/corporate tax ratio and the individual/corporate income ratio. When individuals can shift income between the individual and corporate tax systems, the greater the difference between the tax rates, the greater the incentive to shift income to take advantage of the lower rate. Figure A-1 provides an estimate of the potential magnitude of this shift by comparing the individual/corporate tax ratio to the individual/corporate income ratio.
Specifically, Figure A-1 shows a linear regression between the individual/corporate tax ratio (X axis) and the individual/corporate income ratio (Y axis). The tax ratio is the net-of-tax rate for individual income categories divided by the net-of-tax rate for C Corps.[36] (The net-of-tax rate is equal to one minus the tax rate.) The income ratio is either AGI or net income for individual income categories divided by total C Corp net income.[37]
Based on the combined data for each of the historical periods considered in this issue brief, a 1.0 percent change in the tax ratio corresponds to a 2.7 percent change in the income ratio (left panel). Results for various sub-periods typically range from less than 2.0 percent to nearly 4.0 percent (right panel). This range illustrates the difficulty of estimating the value of the ETI, which depends on the interaction between the individual and corporate tax systems, as well as the period being considered.
Figure A-1: Correlation Between Tax Ratio and Income Ratio (1914-39, 1960-75, 1980-90)
A linear regression including the individual and corporate net-of-tax rates separately (rather than the ratio) indicates a one percent change in the net-of-tax income rate results in a 1.6 percent change in the individual/corporate income ratio, after controlling for the net-of-tax corporate rate; and a one percent change in the net-of-tax corporate rate results in a -1.3 percent change in the individual/corporate income ratio, after controlling for the net-of-tax individual rate. Both coefficients are statistically significant (p<0.001) and have the expected signs (+/-) with an adjusted R^2 of 0.87.[38]
____________________________________________________________________________________
[1] Taxes | Gallup Historical Trends; U.S. Public Opinion and Increased Taxes on the Rich | (gallup.com); Americans’ Long-Standing Interest in Taxing the Rich | (gallup.com); Most Americans Say They Want the Rich to Pay Higher Taxes | Money
[2] SOI Tax Stats – Historical Table 23 | (irs.gov); Statutory rates above 90 percent were subject to a maximum effective rate limitation ranging from 77 to 90 percent. For current tax rates see, Federal income tax rates and brackets | (irs.gov)
[3] The Road Not Taken: Moore v. United States and Due Process – The Concord Coalition
[4] Technically, the top corporate rate is not the highest rate because the lowest tax brackets are phased out by imposing higher rates in the intermediate tax brackets, so corporations in the highest tax bracket effectively pay the top rate on all their taxable income.
[5] SOI Tax Stats – Historical Table 23 | (irs.gov); SOI Tax Stats – Historical Table 24 | irs.gov); Federal Capital Gains Tax Collections, Historical Data | 1954-2018 | (taxfoundation.org); Capital Gains: Legislative History | (everycrsreport.com); Federal Individual Income Tax Treatment of Dividends | Tax Foundation; Dividends were exempt from the normal tax, but not the surtax. The Taxation of Dividends: Background and Overview | (congress.gov); Corporate rates do not include the excess profits tax enacted during WWI and WWII. Excess Profits Tax: Not as Effective or Harmless as Advocates Portray | (taxfoundation.org)
[6] Historical Data on Federal Debt Held by the Public | (cbo.gov)
[7] The weighted average reflects the amount of income taxed at each MTR, rather than the number of taxpayers taxed at each MTR.
[8] 75HrgTaxEvasion1.pdf | (senate.gov); See the list of 47 schemes identified on pp. 191-192
[9] Ibid, (p.148) Director Cecil de Mille created a corporation that sold his services and paid the lower corporate rate, while providing him with a modest salary that was taxed at the higher individual rate.
[10] How a 91% rate sparked the golden age of tax avoidance in 1950s Hollywood | (latimes.com)
[11] Collapsible Corporations under the Tax Reform Act of 1986 | (csuohio.edu)
[12] Statutory rates above 90 percent were subject to a maximum effective rate limitation ranging from 77 to 90 percent. See note #2 above.
[13] w0613.pdf (nber.org)
[14] SOI Tax Stats Archive – 1934 to 1953 Statistics of Income Report, Part 1 | (irs.gov) In 1944, the IRS began reporting adjusted gross income, rather than net income.
[15] The Personal Tax Surcharge and Consumer Demand, 1968-70 | (brookings.edu)
[16] SOI Tax Stats Archive – 1954 to 1999 Individual Income Tax Return Reports | (irs.gov)
[17] Americans’ Long-Standing Interest in Taxing the Rich (gallup.com); Most Americans Say They Want the Rich to Pay Higher Taxes | Money
[18] SOI tax stats – Individual high income tax returns | (irs.gov) Expanded income includes items that are not included in AGI, such as tax-exempt interest, non-taxable Social Security benefits, and the foreign income exclusion. Refundable tax credits can result in negative income tax rates.
[19] Publication 1136 (Rev. 2-2024) | (irs.gov), p.12
[20] Fixed Income Chart | SIFMA; In 2022, the market value of municipal bonds outstanding was $4 trillion.
[21] Reexamining the Tax Exemption of Municipal Bond Interest | (taxfoundation.org)
[22] TAX EXPENDITURES FISCAL YEAR 2024 | (treasury.gov); Table 1, Addendum
[23] SOI tax stats – Individual high income tax returns | (irs.gov)
[24] The Distribution of Household Income in 2020 | (cbo.gov)
[25] CBO numbers differ from the IRS numbers presented above in part because CBO adds Census data to the IRS data to account for households that do not file a tax return.
[26] For a discussion of the limitations of CBO’s methodology of imputing corporate taxes to households, see Will President Biden Raise Your Taxes – and How Will You Know? – The Concord Coalition (Appendix 1)
[27] How CBO Analyzes the Effects of Changes in Federal Fiscal Policies on the Economy | (cbo.gov); BLTN-88.PDF | (iret.org)
[28] The present value is $1/(1+r)^n, and the rate of return is $1*(1+r)^n, where r is the discount rate and n is the number of years in the future.
[29] SCB, Returns for Domestic Nonfinancial Business, March 2022 (bea.gov) The data presented in this report do not distinguish between C Corps and S Corps, thus the after-tax return does not include individual income taxes on S Corps, nor does it include individual income taxes on the interest, dividends, and capital gains related to C Corps.
[30] How are S corporations reported in the NIPAs? | (bea.gov); Prototype NIPA Estimates of Profits for S Corporations | (bea.gov)
[31] Fixed Assets | U.S. Bureau of Economic Analysis (BEA) Table 6.1; National GDP & Personal Income | U.S. Bureau of Economic Analysis (BEA) Table 1.14
[32] Marginal Federal Tax Rates on Labor Income: 1962 to 2028 | (cbo.gov); Taxing Capital Income: Effective Marginal Tax Rates Under 2014 Law and Selected Policy Options | (cbo.gov); How Taxes Affect the Incentive to Invest in New Intangible Assets | (cbo.gov)
[33] The Economic Effects of Financing a Large and Permanent Increase in Government Spending | (cbo.gov); Some Tax Hikes Are More Damaging Than Others, New Analysis Shows | (taxfoundation.org) These results may vary (either higher or lower) depending on how the government spends the additional revenue.
[34] The Budget and Economic Outlook: 2024 to 2034 | (cbo.gov) page 37
[35] Responsiveness to Marginal Tax Rates | (cbo.gov); Are “Real” Responses to Taxes Simply Income Shifting Between Corporate and Personal Tax Bases? | NBER; saez-slemrod-giertzJEL12.pdf | (berkeley.edu)
[36] The available IRS data do not readily permit the calculation of a weighted average marginal tax rate (MTR) for C Corps, so the average effective tax rate (T) is used instead, where T is total taxes (including excess profit taxes) divided by total C Corp net income.
[37] The net-of-tax rate varies for each individual income category, which start at income over $5,000 (1914-1939), $10,000 (1960-1975), and $20,000 (1980-1990) and end at income over $1 million (all years).
[38] Individual IncomeAGI(n)/Corporate income = (1-MTRindv)AGI(n) + (1-MTRcorp) + AGI(n)/GDP Per Capita, where (n) is the AGI (or net income) category ranging from $5,000 to $1 million.
Continue Reading
