September 4, 2024
In 1994, President Clinton appointed us to co-chair the Bipartisan Commission on Entitlement and Tax Reform. We were hopeful that Congress and the President would come together on a plan to put the budget on a sustainable path. For a time that seemed possible. Deficits turned to surpluses and by 2000, some people worried that we would actually pay off the debt “too fast.” That did not happen. By 2002, deficits resumed, and they have been on a relentless upward path ever since.
In our introduction to the August 1994 Interim Report of the Commission we wrote:
America is at a fiscal crossroads – if we act, we can help ensure continued growth and prosperity, but if we fail to act, we threaten the financial future of our children and our Nation. This Report demands action. If the country does not respond, Americans 10, 15, and 20 years from now will ask why we had so little foresight.
Thirty years have passed, and the American people have a right to ask that question. Why has there been so little action? There is no good answer. So, we are issuing a challenge to a new generation of national leaders: Take up this cause. Solve this problem.
If they want some bipartisan guidance, here are seven findings that 30 of our 32 commission members agreed to 30 years ago:
- To ensure that today’s debt and spending commitments do not unfairly burden America’s children, the government must act now. A bipartisan coalition of Congress, led by the President, must resolve the long-term imbalance between the government’s entitlement promises and the funds it will have available to pay for them.
- To ensure the level of private investment necessary for long-term economic growth and prosperity, national savings must be raised substantially.
- To ensure that funds are available for essential and appropriate government programs, the Nation cannot continue to allow entitlements to consume a rapidly increasing share of the Federal Budget.
- To be effective, any attempt to control long-term entitlement growth must take into account the projected increases in health care costs.
- To be effective, any attempt to control long-term entitlement growth must also take into account fundamental demographic changes.
- To respond to the Medicare Trustees’ call to action and ensure Medicare’s long-term viability, spending and revenues available for the program must be brought into long-term balance.
- To respond to the Social Security Trustees’ call to action and ensure the long-term viability of Social Security, spending and revenues available for the program must be brought into long-term balance. Any savings that result should be used to restore the long-term soundness of the Social Security Trust Fund.
Sadly, these findings are still valid. We urge all of the 2024 congressional and presidential candidates to embrace these findings as the framework for their fiscal policy proposals. If candidates have objections to our findings, let them explain those objections. If they support the Do Nothing Plan, let them declare so publicly and own the consequences. In any event, we must move beyond tired partisan talking points.
Thirty years of procrastination is enough.
Senator J. Robert Kerrey (Ret) Senator John C. Danforth (Ret)
FINDING NUMBER 1:
To ensure that today‘s debt and spending commitments do not unfairly burden America’s children, the government must act now. A bipartisan coalition of Congress, led by the President, must resolve the long-term imbalance between the government’s entitlement promises and the funds it will have available to pay for them.
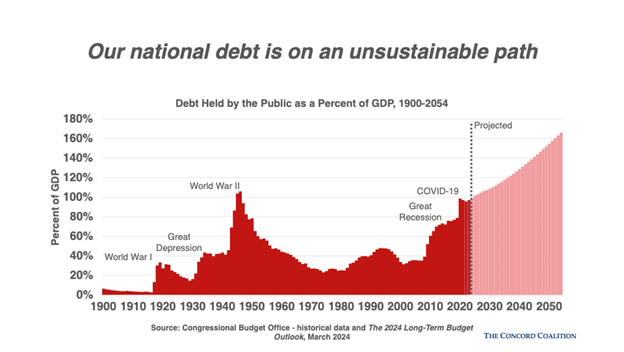
- Current trends are not sustainable. There is a widening structural gap between spending and revenues. Over the next 30 years, the Congressional Budget Office (CBO) projects that mandatory spending (mostly entitlements) is projected to grow by 2.3 percent of GDP. Revenues are projected to grow as well, but only by 1.3 percent of GDP.
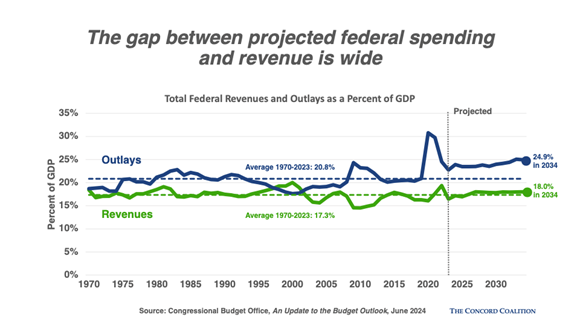
- CBO projects that under current law annual federal budget deficits will average 6.7 percent of GDP over the next 30 years, far exceeding the average over the past 30 years (3.8 percent). By 2054, CBO projects that the deficit will reach 8.5 percent of GDP.
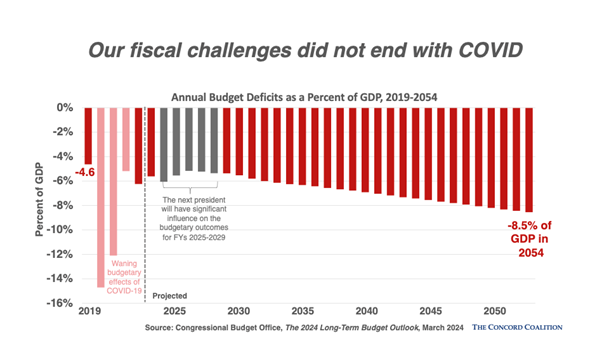
- In 2027, federal debt held by the public, at 106.2 percent of GDP, is projected to exceed the highest level in U.S. history, which came at the end of World War II. By 2054 the debt level is projected to reach 166 percent of GDP.
- Even that dire projection is probably optimistic because it assumes that the 2017 “temporary” tax cuts will expire rather than become permanent, and that annual discretionary spending will decline to an historically low level as a share of GDP.
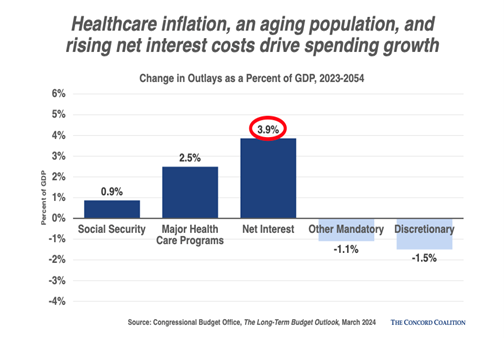
- Interest payments on the debt have become the fastest growing part of the budget, exceeding both defense and Medicare this year. Interest costs will reach a record as a share of GDP in 2025 and under current law CBO projects it will more than double by 2054, eclipsing Social Security in 2051 as the largest federal expenditure.
- Social Security and Medicare contribute to rising deficits. They do not “pay for themselves.” While each program has dedicated sources of income, such as payroll taxes and Medicare premiums, these resources do not pay for all of the costs. According to CBO, the Social Security and Medicare cash deficit will total 2.2 percent of GDP this year and more than double to 5 percent of GDP in 2054.
FINDING NUMBER 2:
To ensure the level of private investment necessary for long-term economic growth and prosperity, national savings must be raised substantially.
- National savings has declined significantly in recent decades. As a result, the U.S. is more dependent on money borrowed from other countries to maintain and expand our domestic stock of physical capital and intellectual property.
- According to the Bureau of Economic Analysis, total public and private investment has averaged 22 percent of national income since 1950, whereas the amount of domestic savings available to fund this investment has averaged 20 percent. Foreign investment is needed to fill the gap. That means more of our future income will go toward repaying foreign investors.
- “Capital consumption” reflects the rate at which existing assets decline in value due to their physical deterioration or technological obsolescence. Because capital consumption has been rising in recent years, a greater share of current investment is needed just to maintain or replace existing assets. Thus, the amount of savings available for (net) new investment has diminished.
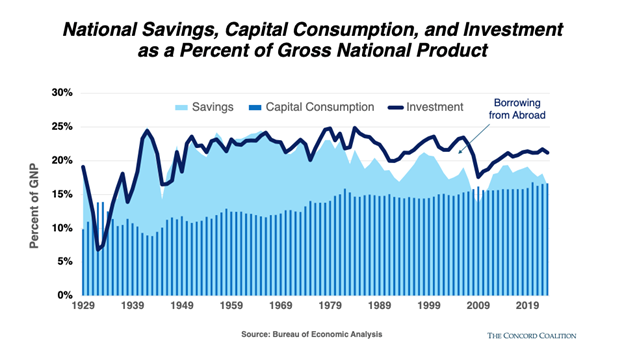
- National savings is critical to economic growth and a rising standard of living. As CBO has noted, “Higher debt would reduce the amount of U.S. savings devoted to productive capital (resources that produce economic benefits over time) and thus would result in lower incomes than would otherwise occur, making future generations worse off.”
- Allowing the publicly held federal debt to rise as a share of our economy from 99 percent in 2024 to 166 percent in 2054, as projected by CBO under current law, would reduce annual per capita income by $5,500.
- A well-designed deficit reduction plan would increase savings and investment, which would contribute to worker productivity. Higher productivity is critically important at a time when our nation faces slower economic growth due to the retirement of the baby boom generation and falling fertility rates.
FINDING NUMBER 3:
To ensure that funds are available for essential and appropriate government programs, the nation cannot continue to allow entitlements to consume an increasing share of the federal budget.
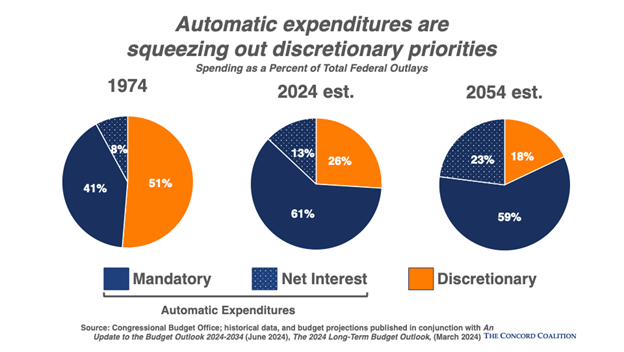
- Discretionary spending is still being squeezed. CBO projects that In 2025 outlays for mandatory spending and interest on the debt will consume all federal tax revenues.
- Spending on annual appropriations (discretionary spending) has steadily fallen over the past 50 years when measured as a share of GDP or as a share of total federal spending. In 1974, discretionary spending was 9.3 percent of GDP and 51 percent of the budget. By 1994, it had come down to 7.5 percent of GDP and 37 percent of the budget. Today, discretionary spending is 6.3 percent of GDP and 26 percent of the budget. Under current law, CBO projects that it will continue falling to 5.5 percent of GDP and 22 percent of the budget in 2034.
- If current law continues, in 10 years, both defense spending (at 2.8 percent of GDP) and non-defense spending (at 2.7 percent of GDP) will be lower than any time on record (1962 is the earliest year such records were kept).
- That dynamic that is transforming the federal budget into little more than an automated check writing machine to individuals. Such transfer payments have grown from 57 percent of the budget in 1994 to 71 percent today.FINDING NUMBER 4:To be effective, any attempt to control long-term entitlement growth must take into account the projected increases in health care costs.
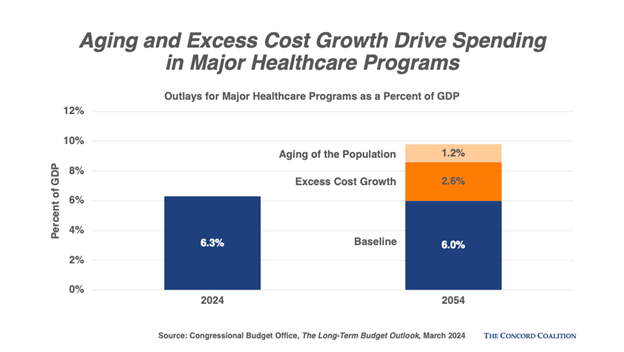
- Roughly 28 percent of non-interest federal spending is devoted to healthcare. The cost of providing healthcare is thus a key component of spending growth. Under current law, CBO projects that by 2054 the share of non-interest federal spending devoted to healthcare will rise to 39 percent.
- Historically, healthcare costs have generally increased faster than the economy, resulting in a rising share of total expenditures. National health expenditures have risen from 5 percent of GDP in 1960, prior to the creation of Medicare and Medicaid, to 17 percent in 2022.
- Recently, there has been some good news on this front as healthcare costs have slowed to the same rate as economic growth, essentially stabilizing national health expenditures at 17 percent of GDP throughout the previous decade (excluding the height of the Covid pandemic).
- The reasons for this slowdown are not well-understood. Perhaps reminiscent of the short-lived slowdown in the 1990s, there is also a high degree of uncertainty about whether this slowdown represents a sustainable trend. In fact, the Centers for Medicare and Medicaid Services (CMS) reported in June of 2024 that “During 2027–32, personal health care price inflation and growth in the use of health care services and goods contribute to projected health spending that grows at a faster rate than the rest of the economy.” As a result, national health expenditures are projected to reach nearly 20 percent of GDP by 2032.
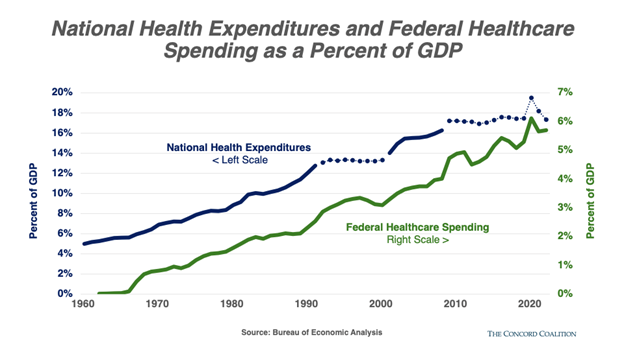
- Moreover, federal healthcare programs like Medicare and Medicaid have not exhibited the same trend during the most recent slowdown, having risen 20 percent more than national health expenditures.
- Although the slowdown has led to a reduction in the expected level of future spending, the government’s major healthcare programs are still projected to rise from less than 6 percent of GDP this year to more than 8 percent over the next thirty years — faster growth than any other category of spending, aside from interest on the federal debt. About one-third of that increase is attributable to population aging, while the remaining two-thirds comes from rising costs per beneficiary.
- Current projections for slower healthcare cost growth would necessitate a transformation of the healthcare system through means that are still mostly untested and uncertain. Even if successful, this transformation would merely hold spending and debt to their current unsustainable levels.
FINDING NUMBER 5:
To be effective, any attempt to control long-term entitlement growth must take into account fundamental demographic changes.
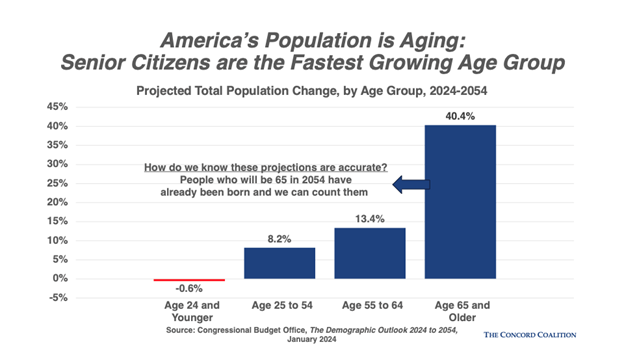
- An aging population and slowing workforce growth will make it increasingly difficult for our economy to carry the rising debt burden.
- The baby boom generation has mostly hit retirement age, with the youngest boomers turning 60 this year and the oldest turning 78. In 1994, 12 percent of the population was 65 and over. Now 18 percent are 65+ and by 2054 it is projected to be 22 percent.
- A large part of population aging is caused by falling fertility rates. The fertility rate is important because it determines – along with net immigration and average life expectancies – whether the total population will rise or fall in the future. A rising population contributes to economic growth, increases the ratio of workers to retirees, and makes it easier to fund programs like Social Security and Medicare. A declining population does the reverse.
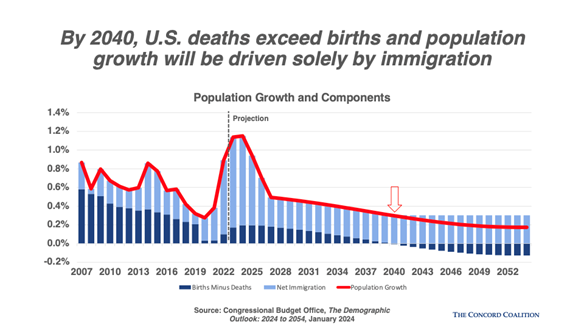
- In 1994, the fertility rate was roughly consistent with the replacement rate. That rate has steadily declined since the Great Recession of 2008-09 and CBO now projects that by 2040 there will be more deaths in the U.S. than births.
- From a budgetary perspective, an aging population means greater spending on retirement and health care programs, most notably Medicare, Medicaid, and Social Security. These programs account for all of the projected growth in non-interest federal spending relative to the size of the economy over the next 30 years.
- Population aging is also a drag on the economy. CBO projects a roughly one-third drop in the economy’s growth rate over the next 30 years (adjusted for inflation). Most of this is caused by slowing labor force growth. According to the CBO, labor force growth will drop dramatically over the next 30 years from an average annual rate of 0.9 percent in the past 30 years to just 0.2 percent.
FINDING NUMBER 6:
To respond to the Medicare Trustees’ call to action and ensure Medicare’s long-term viability, spending and revenues available for the program must be brought into long-term balance.
- In their May 2024 report the Medicare Trustees warned, “Current-law projections indicate that Medicare still faces a substantial financial shortfall that will need to be addressed with further legislation. Such legislation should be enacted sooner rather than later to minimize the impact on beneficiaries, providers, and taxpayers.”
- Medicare’s finances are often assessed by looking at the projected exhaustion date for the Part A Hospital Insurance Trust Fund (HI). That date is 2036 according to the Trustees, but Medicare’s future must also be assessed by looking at the growing cost of Parts B and D of the Supplemental Insurance program (SMI) which get 75 percent of their funding from general revenues.
- In total, general revenue transfers cover 44 percent of Medicare costs today and are expected to cover 50 percent by 2098 (the traditional 75-year evaluation period used by the Trustees).
- The Trustees estimate that Medicare spending will rise by 65 percent as a share of GDP over the next 75 years.
- These projections may well be optimistic. Congress has enacted ambitious long-term growth targets for a wide range of medical services that will be difficult to achieve.
- The Medicare actuaries have consistently warned that these provisions may be unrealistic, saying, “actual Medicare expenditures are likely to exceed the projections shown in the 2024 Trustees Report for current law, possibly by considerable amounts.”
- If the presumed growth targets fail to materialize, the actuaries estimate that Medicare expenses would be roughly 35 percent higher than projected over the next 75 years.
FINDING NUMBER 7:
To respond to the Social Security Trustees’ call to action and ensure the long-term viability of Social Security, spending and revenues available for the program must be brought into long-term balance. Any savings that result should be used to restore the long-term soundness of the Social Security trust fund.
- Social Security provides retirement benefits to more than 90 percent of elderly Americans. Nearly 40 percent of seniors receive more than half of their income from Social Security.
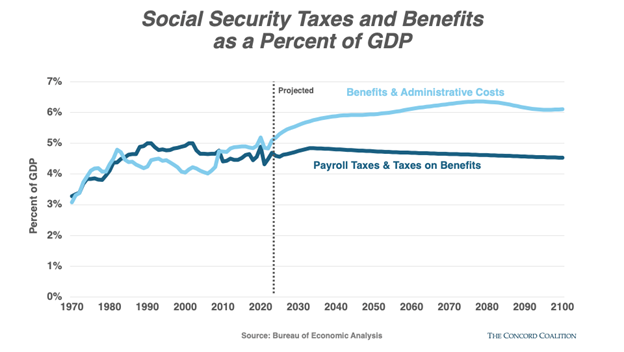
- But Americans are living longer and having fewer children. That means there will be fewer workers to support each beneficiary in the future. As a result of this demographic shift, Social Security will be unable to pay future benefits in full and on time.
- The Social Security program has two trust funds, Old-Age and Survivors Insurance (OASI) and Disability Insurance (DI). The Social Security Trustees have projected the combined trust fund balance will be exhausted in 2035 and beneficiaries will face an across-the-board cut of roughly 17 percent, with even larger reductions thereafter.
- The trust fund balance merely provides the legal authority to pay benefits. What matters from a cash-flow perspective is the amount of dedicated revenue relative to the cost of benefits. From this perspective, the annual shortfall is projected to rise from 0.6 percent of GDP in 2024 to 1.3 percent of GDP in 2054. That’s equivalent to $366 billion in today’s dollars.
- Congress and the President have previously acted in a bipartisan manner to address the financing short-fall facing Social Security, most recently in 1983. They must undertake such an effort again. The sooner they do, the more time the public will have to prepare for the changes necessary to secure their future retirement benefits.
Continue Reading

