
Introduction
According to the Congressional Budget Office (CBO), the federal government will continue to face a large and growing shortfall between taxes and spending, resulting in a rising level of federal debt held by the public.[1] This debt will crowd out private sector investment and reduce the standard of living of future generations relative to what it would otherwise be.[2] Excessive debt can also lead to higher inflation as well as precipitate a fiscal crisis.[3]
To avoid these adverse outcomes, policymakers could adopt some form of means-testing which would limit the benefits from some federal programs or policies, based on income or wealth. Means-testing can be accomplished by reducing or eliminating benefits paid to higher-income individuals, or by including the value of benefits in taxable income or charging income-related premiums. Policymakers could also limit tax expenditures, which are often described as spending through the tax code. Each of these policies would reduce annual budget deficits and slow the accumulation of additional federal debt.
This issue brief will examine different approaches to means-testing, estimate their budgetary effects, and consider their public policy implications. It concludes that limiting federal benefits would achieve only modest savings, unless the limits were extended to the middle-class. Limiting tax expenditures would achieve substantial deficit reduction, but less than current estimates suggest due to offsetting changes in individual behavior, the federal budget, and the overall economy.
Means-Testing Federal Benefits
Means-testing is a term used to describe any policy that limits federal benefits based on income or wealth. These limits can be imposed by reducing benefits directly, or by including benefits in taxable income. Due to the progressive nature of the income tax, higher-income individuals pay higher marginal tax rates, thereby forgoing a larger share of their benefits.[4]
Means-testing is most often associated with “welfare” programs that are aimed at helping lower-income individuals, such as Supplemental Security Income (SSI) and Medicaid.[5] For these programs, benefits are reduced, or eligibility is denied as income or wealth increases. This approach to means-testing results in less spending.
Social insurance programs like Social Security and Medicare are subject to a different kind of means-testing that results in more revenue, rather than less spending. In the case of Social Security, beneficiaries with income above certain thresholds must include up to 85 percent of their benefits in their taxable income.[6] In the case of Medicare, most individuals pay a premium for Part B (physician and outpatient services) and Part D (prescription drugs) that covers about 25 percent of the cost of these benefits. But higher-income individuals are required to pay higher premiums that cover up to 85 percent.[7] Modifying or expanding these policies would result in additional revenue. For example, Part B and Part D premiums could be increased to 100 percent for individuals with higher incomes. Although Part A is primarily funded by payroll taxes on workers, rather than premiums on beneficiaries, the value of these benefits could be included in taxable income.[8]
Means-testing could also be applied to federal tax expenditures. Tax expenditures are credits, deductions, exclusions, and other preferences in the tax code that reduce federal revenue. For example, the partial exclusion of Social Security benefits from taxable income is considered a tax expenditure. Eliminating this exclusion entirely would raise additional revenue. However, there are problems with the methodology used to define and measure tax expenditures that overestimate their impact on the deficit. These problems are discussed below.
The Budgetary Effects of Means-Testing
The budgetary effects of means-testing depend on the distribution of spending and revenue, as well as how the policy is implemented. This issue brief will consider two hypothetical approaches to means-testing Social Security and Medicare, as well as a limit on major tax expenditures. The first approach would eliminate benefits for higher-income households. The second approach would include the value of these benefits in taxable income.
Figure 1 shows the distribution of Social Security and Medicare benefits for households in 2019, which is the most recent year available that is consistent with comparable tax expenditure data.[9]
Figure 1: Social Security and Medicare Benefits For Households in 2019 ($Billions)
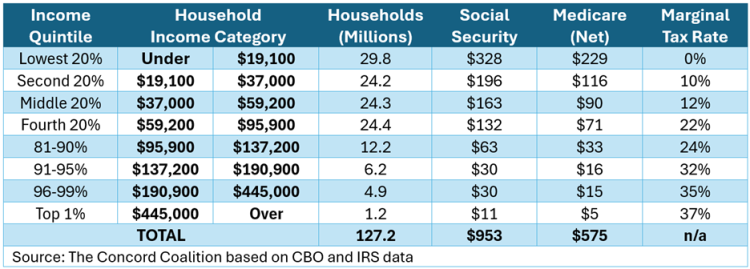
According to CBO, the top 20 percent of households, which is roughly equivalent to individuals earning more than $95,900 per year, received 12 percent of Social Security and Medicare benefits. Medicare is measured on a net basis by subtracting Part B and Part D premiums. Under the first approach, eliminating these benefits would also reduce the amount of income taxes paid on Social Security benefits, thereby reducing the net savings to 10 percent.[10]
To achieve additional savings, benefits would have to be eliminated for households earning less than $95,900. For example, lowering the income threshold to $59,200, thereby covering the top 40 percent of households, would double the net savings from 10 percent to 20 percent of annual benefits.[11]
Alternatively, under the second approach to mean-testing, Social Security and Medicare benefits could be included in taxable income. This approach would expand on current law and tax 100 percent of Social Security benefits, and it would also tax 100 percent of the average per capita value of Medicare benefits, net of Part B and Part D premiums. Figure 1 shows the marginal income tax rates that are assumed to be applicable within each household income category.
Taxing the Social Security and Medicare benefits of the top 20 percent (or 40 percent) of households would increase income taxes by an amount equal to 2 percent (or 3 percent) of annual benefits, after adjusting for the income taxes paid on Social Security under current law.[12]
Taxing the Social Security and Medicare benefits of all households would increase income taxes by an amount equal to 5 percent of annual benefits, after adjusting for the income taxes paid on Social Security under current law. Critics might object to means-testing at all income levels. But the federal income tax is highly progressive, with rates ranging from 0 to 37 percent. Thus, lower-income households would pay no taxes, while higher-income households would lose more than one-third of their benefits through higher taxes.
To place these means-testing policies into context with the overall budgetary problem, Figure 2 compares each alternative to the combined shortfall in Social Security and Medicare in 2019. The shortfall is defined as benefits minus dedicated revenue, which includes payroll taxes and benefit taxes, beneficiary premiums, and other program-specific payments and fees. This calculation shows benefits would have to be reduced by 23 percent to balance annual spending and revenue.[13]
Figure 2: Means-Testing Options vs. Social Security and Medicare Shortfall in 2019
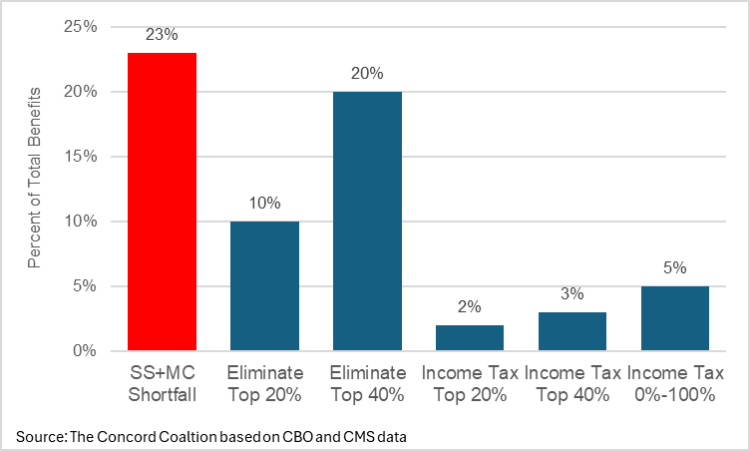
These results suggest eliminating benefits for the top 40 percent of households would eliminate most of the shortfall in Social Security and Medicare. Of course, policymakers are unlikely to eliminate benefits starting at $59,200 in household income. The hypothetical is useful, however, for demonstrating the modest savings that would be gained by a means-test limited to the top 20 percent of households. Moderating this policy by gradually reducing benefits as income rises, rather than eliminating benefits entirely at the designated threshold, would substantially reduce the savings.
Tax Expenditures
Tax expenditures are credits, deductions, exclusions and other preferences in the tax code that reduce federal revenue.[14] Even though these provisions result in less revenue, rather than more spending, they are called “tax expenditures” because they can be seen as an alternative to spending.[15] For example, the government could give money directly to homeowners, or it could allow homeowners to deduct property taxes and mortgage interest from their taxable income. Both policies would subsidize homeownership, but the former would result in more spending while the latter would result in less revenue.
According to CBO, the major tax expenditures cost an estimated $1.2 trillion in 2019.[16] However, eliminating these provisions would not reduce the federal budget deficit by that amount because these estimates do not account for offsetting changes in individual behavior, the federal budget, and the overall economy. The net effect of limiting tax expenditures would be less, and in some cases significantly so.
For example, tax expenditures do not include the interaction between income taxes and payroll taxes. Under current law, employer-provided health insurance and pension contributions are excluded from taxable wages. Eliminating this exclusion would increase both income taxes and payroll taxes, but the net revenue effect would be reduced due to the offsetting reduction in wages that would occur when the employer share of the payroll tax is shifted to workers in the form of lower wages.[17]
In addition, counting employer-provided health insurance and pension contributions as part of taxable wages would increase future Social Security benefits, thereby offsetting most of the additional payroll tax revenue. Tax expenditure calculations do not include these future benefits. The Social Security Administration (SSA) has estimated the additional benefits would eventually offset more than two-thirds of the additional revenue.[18]
Figure 3 shows the major tax expenditures in 2019. It is important to note these estimates are based on temporary tax provisions enacted into law in 2017. Assuming these provisions are allowed to expire at the end of 2025, some tax expenditures would be considerably larger or smaller. For example, the state and local tax deduction would be $123 billion, instead of $22 billion, whereas the child tax credit would be $53 billion, instead of $117 billion.[19]
Figure 3: Distribution of Major Tax Expenditures in 2019 ($Billions)

As Figure 3 shows, the largest tax expenditures are the exclusions for employer-provided benefits and individual retirement contributions, which total $556 billion in combined income and payroll taxes. Eliminating these exclusions for the top 20 percent of households would ostensibly increase revenue by $277 billion, or $435 billion for the top 40 percent of households. These amounts are equivalent to 16 percent or 26 percent, respectively, of total Social Security and Medicare benefits in 2019, compared to the 23 percent shortfall shown in Figure 2.
However, these figures do not account for the offsetting reduction in taxable wages and the corresponding increase in Social Security benefits, as noted above. In addition, it may be politically difficult to enact policies that substantially reduce or eliminate these major tax expenditures.
The Affordable Care Act originally contained a provision to limit the tax expenditure for employer-provided health insurance. This provision would have imposed an excise tax on high-cost health plans. The imposition of this tax was delayed and then repealed before it ever took effect due to bipartisan opposition.[20]
The tax expenditure for pensions and retirement contributions assumes that unrealized gains on investments held by individuals and employers on behalf of their workers are taxed each year. But the Supreme Court’s recent decision in Moore v. United States raises questions about whether a tax on unrealized gains would be constitutional.[21]
The next largest tax expenditure is the preferential tax rate on capital gains and dividends. Under current law, the maximum marginal tax rate is 20 percent, plus the 3.8 percent net investment income tax (NIIT), whereas the maximum rate on other income is 37 percent, plus the NIIT when applicable.[22] But eliminating the preferential rate would not generate the $139 billion in revenue shown in Figure 3 because this estimate does not account for changes in individual behavior or the overall economy.
Because individuals generally get to choose when they sell their assets and realize capital gains, whenever tax rates go up, fewer capital gains are realized.[23] Tax expenditure estimates do not account for this behavioral change and thus overstate the amount of revenue that would result from eliminating the preferential tax rate, especially in the short run.
The preferential rate on capital gains and dividends could also be viewed as a reduction in a penalty, rather than the granting of a subsidy, because it merely mitigates, rather than eliminates, the double taxation of corporate profits.[24] This double taxation increases the cost of capital and reduces total investment in the overall economy. Tax expenditure estimates do not account for these economic feedback effects.
When corporations earn profits, those profits are taxed at the corporate rate. When corporations use after-tax profits to pay dividends to investors, those dividends are taxed again at the individual rate. When corporations use after-tax profits to make investments, those investments typically increase future profits which result in higher stock prices that investors may realize as capital gains. Because future profits will be taxed at the corporate rate, the individual tax on capital gains is an additional tax on the present value of those profits.[25]
Conclusion
According to CBO, Social Security and Medicare will account for almost 90 percent of the projected increase in federal spending (excluding interest on the debt) over the next thirty years, while other categories of non-interest spending (excluding Medicaid) are projected to decline as a share of GDP.[26] Medicaid accounts for the remaining increase, but it’s already means-tested.
To address the rising level of deficits and debt that will result from this increased spending, policymakers might consider further means-testing Social Security and Medicare. This could be accomplished by imposing additional limits on benefits for higher-income individuals or by including a greater share of benefits in taxable income. Although the savings from these policies would not fully address the budgetary shortfall, these savings could be supplemented with limits on tax expenditures.
In general, limiting tax expenditures will broaden the base of taxable income without increasing marginal tax rates, thereby minimizing the negative impact of higher taxes on the economy. However, in some cases, limiting tax expenditures will not generate as much revenue as current estimates suggest due to budgetary interactions and adverse effects on the economy.
[1] The Long-Term Budget Outlook: 2024 to 2054 | (cbo.gov)
[2] Passing the Buck: How The National Debt Burdens Future Generations – The Concord Coalition
[3] 07-27_debt_fiscalcrisis_brief.pdf | (cbo.gov)
[4] Federal income tax rates and brackets | (irs.gov)
[5] Who can get SSI | (ssa.gov); Medicaid Eligibility | Medicaid
[6] Taxation of benefits | (ssa.gov); Taxing Social Security Benefits – The Concord Coalition
[7] 2024 Medicare Parts A & B Premiums and Deductibles | (cms.gov); Benefits Planner: Retirement | Medicare Premiums | (ssa.gov)
[8] Social Security and Medicare Benefits and Taxes: 2023 | Urban Institute
[9] The Distribution of Household Income in 2020 | (cbo.gov) The benefits attributed to households is less than 100 percent due to underreporting in Census data and non-filers in IRS data, as well as the exclusion of individuals living in prisons, nursing homes, and military bases. CBO uses a household equivalence scale based on the square root of the number of people in each household to determine the income distribution. Households are ranked by market income.
[10] The Concord Coalition calculations
[11] The Concord Coalition calculations
[12] The Concord Coalition calculations
[13] 2020-medicare-trustees-report.pdf (cms.gov) Table V.F1
[14] Tax Expenditures: Background and Evaluation Criteria and Questions | (gao.gov)
[15] Using the term “tax expenditures” to describe provisions in the tax code that reduce taxes – rather than increase spending – is somewhat analogous to using the terms “refundable tax credit” or “negative income tax” to describe cash payments to individuals that exceed their tax liability.
[16 ]How Specifications of the Reference Tax System Affect CBO’s Estimates of Tax Expenditures | (cbo.gov); BLTN-84.PDF (iret.org)
[17] The Distribution of Major Tax Expenditures in 2019 | (cbo.gov)
[18] The Limit on Social Security Taxes and Benefits – The Concord Coalition See Payroll Taxes vs Income Taxes; 57089-Payroll-Taxes.pdf | (cbo.gov) “…changes in payroll tax thresholds or in the share of total compensation that is taxable would be associated with more than full pass-through of the tax to employees.”
[19] Distributional Effects of Applying Social Security Taxes to Employer-Sponsored Health Insurance Premiums | (ssa.gov); Long Range Solvency Provisions | (ssa.gov) The estimates for years after 2010 assume the exclusion is gradually phased-out over time.
[20] The Distribution of Major Tax Expenditures in 2019 | (cbo.gov)
[21] R44147 (congress.gov);
[22] The Road Not Taken: Moore v. United States and Due Process – The Concord Coalition; LSB11185 (congress.gov)
[23] Topic no. 409, Capital gains and losses | (irs.gov); Topic no. 559, Net investment income tax | (irs.gov)
[25] 49817-taxingcapitalincome0.pdf | (cbo.gov); Historical Tax Rates: The Rhetoric and Reality of Taxing the Rich – The Concord Coalition See “Double Taxation and the Economy”
[26] This analysis does not apply to capital gains earned by speculating on the value of corporations that never earn a profit, or when realized profits differ from expected profits.
Continue Reading