Introduction
With inflation rising and economic growth slowing, the Federal Reserve (Fed) faces the difficult task of curbing inflation without causing a recession. The Fed fights inflation with higher interest rates which reduce the demand for goods and services. However, higher interest rates also reduce the supply of goods and services. In the worst-case scenario, supply falls faster than demand resulting in “stagflation” – i.e., higher inflation plus higher unemployment plus slow or zero economic growth.
The Fed’s desire to avoid a recession or stagflation may cause it to stop raising interest rates – or even start lowering them again – before inflation is subdued. That could result in a resurgence of inflation forcing the Fed to raise interest rates even higher than originally anticipated.
The recent surge in inflation provides an opportunity to review the last major inflationary period and consider what the past might tell us about the Fed’s prospects for success in the current environment.
Déjà vu Again?
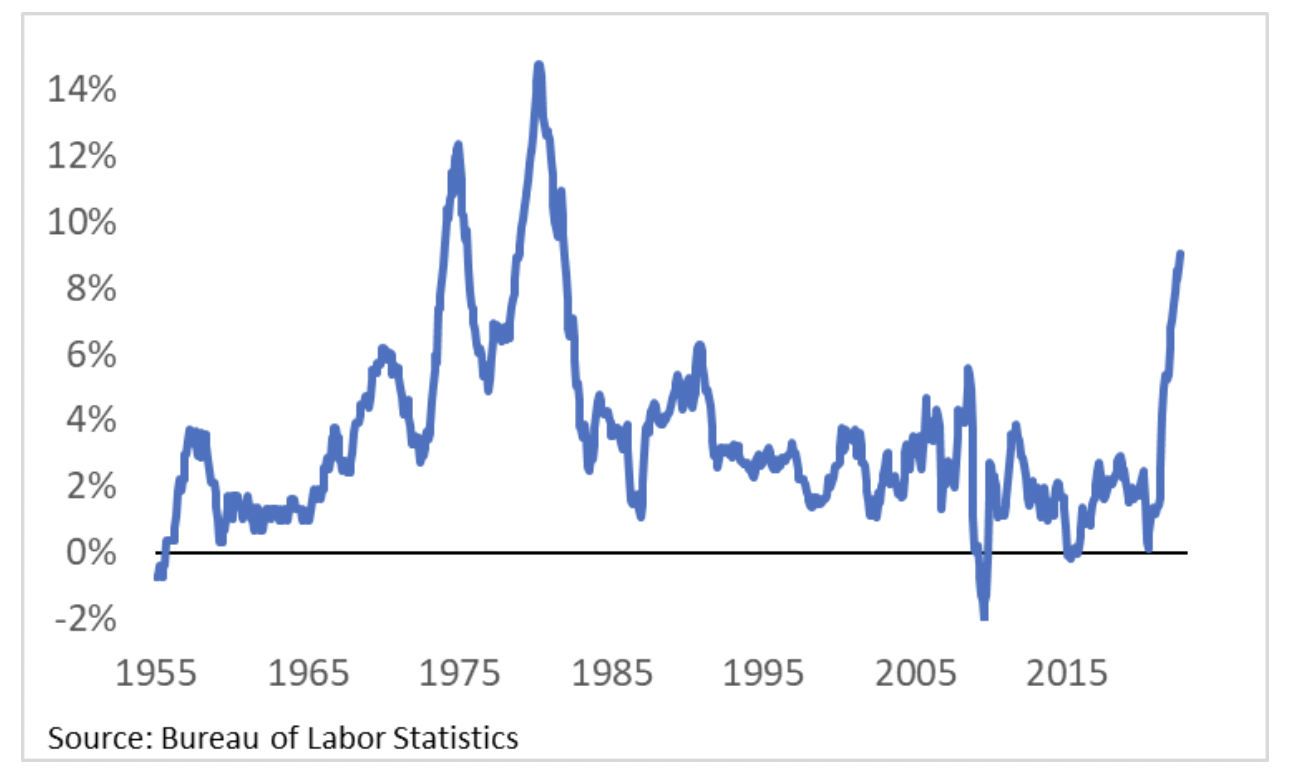
The rapid rise of inflation since mid-2021 has prompted comparisons with the previous inflationary episode in the late-1970s and early-1980s. As Figure 1 shows, the annual inflation rate, as measured by the consumer price index for all urban consumers (CPI-U), is currently at the highest level since 1981. However, such comparisons are misleading due to a change in how inflation is measured. Inflation now would be even higher without that change.
Figure 1: Annual Inflation Rate (CPI-U) 1955-2022

As the White House Council of Economic Advisers recently explained, the Bureau of Labor Statistics (BLS) changed the way it measures inflation in 1983.[1]
“Prior to 1983, however, BLS calculated CPI: Shelter based on housing prices, mortgage rates, property taxes and insurance, and maintenance costs. This approach captured elements of both the service flow—the consumption of housing services—and asset investment aspects of housing expenditures…. But, BLS decided that the investment component was inconsistent with CPI’s role as a cost-of-living index. As a result, after many years of internal debate and testing, in 1983 BLS altered its methodology to the “rental equivalent” approach. Under this framework, owners’ equivalent rent (OER) of primary residence is meant to capture just the implicit value of services that homeowners “consume” from their own homes—not the asset value of the house as an investment.”
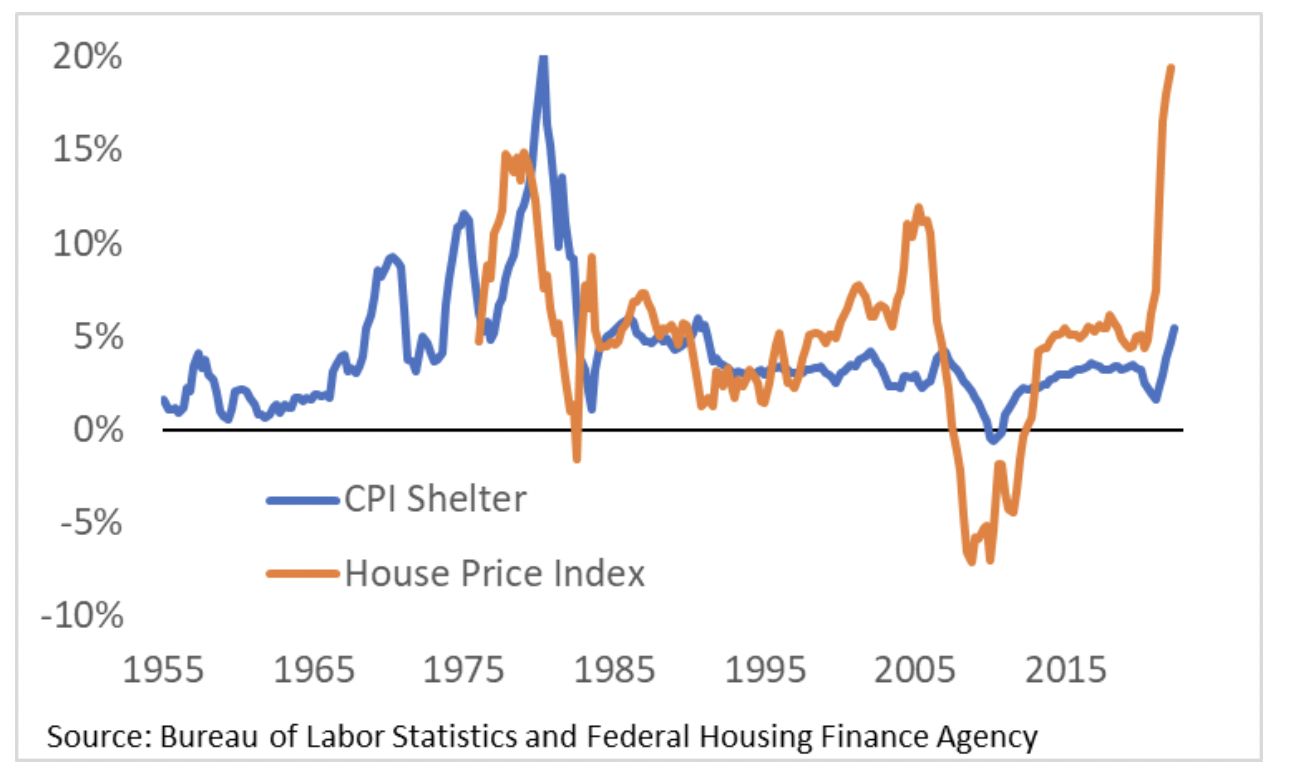
Essentially, the BLS decided buying a house was like investing in the stock market. Therefore, rising home prices, just like rising stock prices, represent a return on investment, rather than inflation. While the merits of the BLS decision are debatable, the result is the consumer price index no longer includes the price of buying a home. However, the Federal Housing Finance Agency (FHFA) maintains data on repeat sales or refinancings of single-family homes.[2] These data provide clear evidence that the current rate of inflation would be even higher if the BLS had not changed the way it measures inflation.[3] Despite this change, it is readily apparent urgent action is needed to address rising prices.
Figure 2: CPI Shelter vs Single-Family Home Prices (1955-2022)

The Fed’s primary monetary policy target is the Federal Funds Rate (FFR).[4] The FFR is the interest rate banks charge each other for overnight loans. The Fed uses various tools such as open market operations, repurchase agreements, and the payment of interest on reserves to increase or decrease the FFR.[5] The Fed’s decisions about when to adjust the FFR and how much to adjust it are more art than science, but history can provide some guidance.
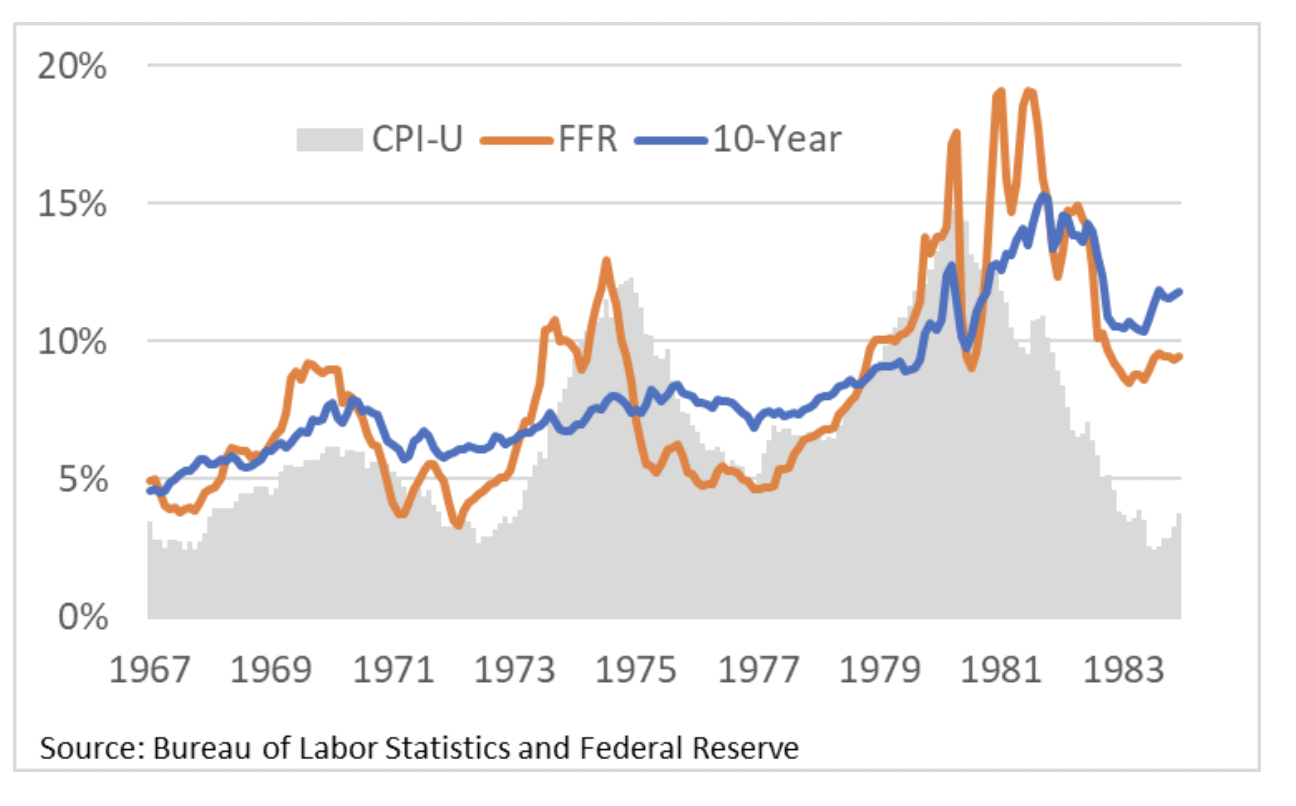
Figure 3 shows how adjustments to the FFR and changes in inflation expectations evolved during the late-1960s through the early-1980s. As inflation began to rise in the late-1960s, long-term interest rates (10-year U.S. Treasury bond rates) also began to rise. To reduce inflation, the Fed increased the FFR above the 10-year rate and inflation temporarily subsided. This cycle was repeated in the mid-1970s with similar results. But as the cycle began again in the late-1970s, financial markets became convinced inflation was not contained. By the early-1980s, 10-year rates continued to rise and remained elevated for an extended period. Essentially, the financial markets lost confidence in the Fed’s ability to control inflation.
Figure 3: Inflation and Interest Rates (1967-1983)

The Fed has regained the confidence of financial markets in recent decades, as evidenced by the fact that the 10-year interest rate remains below three percent, despite the inflation rate being above nine percent.[6] The financial markets seem to believe the current high level of inflation will be transitory.
However, the realization of this belief depends on whether the Fed promptly subdues inflation by aggressively increasing the FFR. Failure to do so, or reversing course in the face of rising unemployment, could result in another loss of confidence causing long-term interest rates to rise, requiring even higher FFR increases, thereby repeating the previous inflationary episode of the 1970s and 1980s.
Past as Prologue?
The Fed attempts to steer the economy along the path of stable prices and maximum employment by adjusting the FFR.[7] As noted above, this process is more art than science. However, regression analysis of historical data suggests there is a statistically significant relationship between inflation rates, interest rates, and unemployment rates.[8] Assuming these relationships continue to hold in the future, they can be used to estimate the potential effects of the Fed’s actions over the next twelve months.[9]
As shown above in Figure 3, the Fed increases the FFR relative to the 10-year rate to fight inflation; and the Fed reduces the FFR relative to the 10-year rate once it believes inflation has been contained. Based on historical experience, it appears inflation does not subside until the FFR temporarily exceeds the 10-year rate, and the 10-year rate exceeds the inflation rate, and the unemployment rate rises. Thus, the slope of the “yield curve,” which is the 10-year rate minus FFR, reflects the interaction between monetary policy and financial market’s expectations of future inflation; and both of these variables interact with the unemployment rate.
Thus, to make predictions about the impact of the Fed’s monetary policy decisions on future inflation, it is necessary to make assumptions about the FFR rate, the unemployment rate, and the slope of the yield curve.
Fed Board members and Fed Bank presidents make quarterly projections of the FFR and the unemployment rate based on their views of appropriate monetary policy. Using the midpoint of their assumptions for 2023, the FFR will be 3.8 percent and the unemployment rate will be 3.9 percent.[10] They do not make projections of long-term interest rates, so their views on the slope of the yield curve are unknown.
Historically, the 10-year rate has exceeded the FFR by 1.0 percentage points, with a standard deviation of 1.6 percentage points. (The standard deviation is the range of variation relative to the average that includes approximately two-thirds of the data.) Regression analysis indicates the slope of the yield curve is critical to the success of the Fed’s actions.
Figure 4 illustrates the potential range of outcomes, starting with the Fed’s assumptions for the FFR and the unemployment rate, while allowing the yield curve to vary between -1.0 and +2.0 percentage points. Given the Fed’s assumptions, a yield curve that differs appreciably from the average will produce implausible results in terms of both inflation rates and real interest rates. However, assuming the yield curve is equal to the historical average, the regression analysis projects the inflation rate would be 3.8 percent in June of 2023.
Figure 4: Projected Inflation Rate (CPI-U) Under Alternative Assumptions

The Fed’s 2.0 percent inflation target is based on the personal consumption expenditure (PCE) price index, which is equivalent to a 2.4 percent CPI-U.[11] Given the historical relationship between inflation rates, interest rates, and unemployment rates, it seems unlikely the Fed will achieve their 2 percent target without increasing the unemployment rate significantly more than they currently anticipate; and higher unemployment typically coincides with a recession.
Conclusion
When efforts to fight inflation fall short of the intended goal, the likely result is more inflation and a loss of confidence in the Fed. A loss of confidence would cause long-term interest rates to rise, requiring the Fed to increase the FFR even higher than anticipated. Until confidence is restored, long-term interest rates would remain elevated, resulting in adverse consequences for the federal budget in terms of higher interest costs on the national debt.
[1] Housing Prices and Inflation | The White House
[2] One-Screen Data Search (bls.gov); FHFA House Price Index | (fhfa.gov)
[3] Owners’ equivalent rent accounts for nearly 25% of the market-basket used to calculate the CPI-U. Measuring Price Change in the CPI: Rent and Rental Equivalence : U.S. Bureau of Labor Statistics (bls.gov)
[4] The Fed can also affect long-term interest rates by buying or selling U.S. Treasury bonds or mortgage-backed securities.
[5] For a more detailed discussion, see The Budgetary Risk of Rising Inflation | Concord Coalition
[6] Other factors have also contributed to lower 10-year rates (e.g., the Basel Accords increased demand for safe, liquid assets; the 2007-2009 global financial crisis caused a flight to safety; the adoption of inflation targeting by central banks, and potentially the Fed’s “Operation Twist”).
[7] Concerns about the unstable relationship between the money supply and the economy caused the Fed to shift its focus to interest rates. Fed Essentially Abandons Money Supply Targets (washingtonpost.com); Fed Abandons Policy Tied to Money Supply (nytimes.com)
[8] The linear regression is estimated as: CPI(t) = CPI(t-1) + (10Y-CPI)(t) + (10Y-CPI)(t-1) + (FFR-CPI)(t) + (FFR-CPI)(t-1) + UR(t) + UR(t-1), where (t) is the monthly rate and (t-1) is the corresponding monthly rate one-year earlier for the period July of 1955 through June of 2022.
[9] Although the regression coefficients are imprecise due to the correlation between the independent variables (i.e., multicollinearity) that does not affect the results of the model with respect to its overall predictions.
[10] The Fed – June 15, 2022: FOMC Projections materials, accessible version (federalreserve.gov)
[11] From 1984 to 2022, the PCE averaged 0.4 percentage points less than the CPI-U. Why the Fed Targets a 2 Percent Inflation Rate (stlouisfed.org)


